Download
1 / 35
360 likes | 543 Views
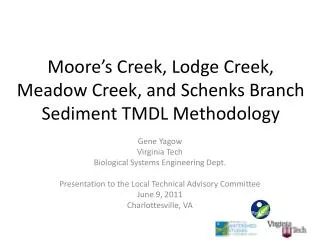
Moore’s Creek, Lodge Creek, Meadow Creek, and Schenks Branch Sediment TMDL Methodology. Gene Yagow Virginia Tech Biological Systems Engineering Dept. Presentation to the Local Technical Advisory Committee June 9, 2011 Charlottesville, VA. Meadow Creek. The Watersheds. Lodge Creek.

E N D
Moore’s Creek, Lodge Creek, Meadow Creek, and Schenks Branch Sediment TMDL Methodology Gene Yagow Virginia Tech Biological Systems Engineering Dept. Presentation to the Local Technical Advisory Committee June 9, 2011 Charlottesville, VA
Meadow Creek The Watersheds Lodge Creek Schenks Branch Moore’s Creek
Stressors and Evidence • Moore’s Creek – sediment • Lodge Creek, Meadow Creek, and Schenks Branch – sediment and hydrologic modifications • Evidence for sediment • Repeated poor scores for sediment metrics in habitat assessment • Observations of insufficient buffer, erosion, and bank instability • Evidence for hydrologic modifications • High percentage of impervious area
Sources of Sediment • Erosion from agricultural runoff, livestock with stream access, barren areas, and forest harvesting • Erosion from residential and urban stormwater runoff, construction sites, and in-stream disturbances • Riparian zones • Non-vegetated areas • Insufficient buffers or buffer width • Channel erosion from unstable stream banks Impacted by increasing impervious area Hydrologic Modifications
P53 Tidal and River Segments P53 = Chesapeake Bay Watershed Model, Phase 5.3 92 Tidal Segments 39 in Virginia 1,185 River Segments, Phase 5.3
P53 Load Designations EOS are edge-of-stream loads at the outlet of a river segment. DEL are delivered loads at the outlet of a tidal segment. River Segment JL1_6770_6850 Tidal Segment JMSTF2 EOS DEL
River Segment JL1_6770_6850 Area = 59,483 acres = 92.9 sq.mi.
Land-River Segments (LRS) Within a River Segment LRS #2 LRS #1 LRS #3 LRS #4
Basic Procedure Overview • Extract loads from Bay model output spreadsheets for • Baseline Scenario (2009 Progress Run) • TMDL Scenario (Final WIP I Run) • Calculate • Load Reduction = Baseline – TMDL • % Reduction = (Baseline – TMDL)/Baseline * 100% • Assess BMPs from corresponding model input decks
P53 Example Loads: A51003JL4_6520_6710 • Specific for each: • Land-river segment • Model Scenario • Delivered to outlet of: • River Segment (EOS) • Tidal Segment (DEL)
LRS #2 B51003JL1_6770_6850 B51125JL1_6770_6850 LRS #3 Sum Loads from All Land-River Segments within a Jurisdiction, Basin, or other Management Unit LRS #1 A51003JL1_6770_6850 LRS #4 A51125JL1_6770_6850
Watersheds and Bay Model (P53) Segments JL4_6520_6710 A51540JL4_6520_6710 A51003JL4_6520_6710
Local Procedure Overview • Extract loads from Bay model output spreadsheets for • Baseline Scenario (2009 Progress Run) • TMDL Scenario (Final WIP I Run) • Calculate unit-area loads (UALs) • Albemarle County and NASS land use • Will define local land use • Will be associated with P53 land use categories • Calculate loads from local land use and UALs
Moore’s Creek Example – Portion of One Land-River Segment(Moore’s Creek – 003) - 003 A51003JL4_6520_6710
Incorporating Local Land Use • P53 Model Output • Identify larger P53 land use Groups, e.g. Row crops, Hay, Pasture • Calculate distribution of areas among component land uses within each Group • Local Land Use • Assign a (P53) land use Group to each of our local land use categories • Distribute Group acreage amongst component land uses
P53 Land Uses, Groups, and Distributions (A51003JL4_6520_6710)
Categorize and Relate Local Land Use to P53 Groups (Moore’s Creek – 003)
Distribute Local Group Acres to P53 Land Uses (Moore’s Creek – 003)
Repeat Procedure for 2nd Moore’s Creek Segment • Sum loads from both Moore’s Creek segments • Repeat for both baseline and TMDL scenarios
Estimate of Livestock Population (afo – animal feeding operations) County Ag Census Farm Count Estimate by % of area in LRS and % pasture % of MC Land-River Segment in Albemarle County
Estimate of Permitted PS Loads Monthly Discharge Monitoring Report Permit Limits Load = Flow * Concentration
BMPs in P53 Scenarios • The effect of changing amounts of BMPs between scenarios is shown either as: • Changes in area from one land use to another • Changes in land use load/acre (UAL) reflecting management BMPs • Model input decks for each scenario define the applicable BMPs for each land use type.
Implications for Local TMDLs • These loads and reductions can serve as a starting point for discussions at the local level regarding: • Identification of improved land use representation • Improved accounting of existing voluntary BMPs • The appropriate mix of BMPs for their locality • Targeting for greatest benefit/cost • Re-modeling is necessary if substantive changes are made in the model input deck
Next Steps • Get feedback on local land use and other load estimates • Land use distribution • Animal population and distribution • SSO load calculations • Significant and non-significant point sources • Calculate existing and TMDL loads for sediment • Prepare Draft TMDL Report and present at a future TAC and a Public Meeting • Setup work groups to transition to Implementation
Questions? • For more information, contact Gene Yagow 540-231-2538 eyagow@vt.edu