Download
1 / 1
20 likes | 129 Views
Linear Regression of Protein on Cover Slip Thomas Johnston, Robert Williams The Wallace H. Coulter Department of Biomedical Engineering (1), Georgia Institute of Technology / Emory University, Atlanta, GA, USA. Method

E N D
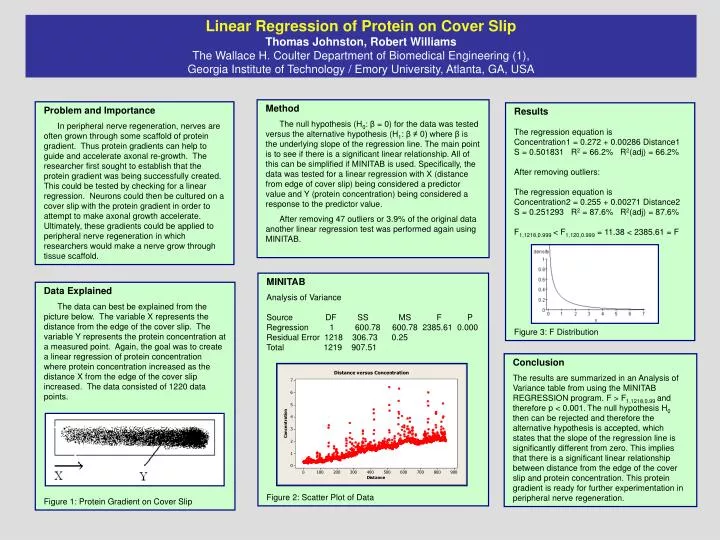
Linear Regression of Protein on Cover Slip Thomas Johnston, Robert Williams The Wallace H. Coulter Department of Biomedical Engineering (1), Georgia Institute of Technology / Emory University, Atlanta, GA, USA Method The null hypothesis (H0: β = 0) for the data was tested versus the alternative hypothesis (H1: β ≠ 0) where β is the underlying slope of the regression line. The main point is to see if there is a significant linear relationship. All of this can be simplified if MINITAB is used. Specifically, the data was tested for a linear regression with X (distance from edge of cover slip) being considered a predictor value and Y (protein concentration) being considered a response to the predictor value. After removing 47 outliers or 3.9% of the original data another linear regression test was performed again using MINITAB. Problem and Importance In peripheral nerve regeneration, nerves are often grown through some scaffold of protein gradient. Thus protein gradients can help to guide and accelerate axonal re-growth. The researcher first sought to establish that the protein gradient was being successfully created. This could be tested by checking for a linear regression. Neurons could then be cultured on a cover slip with the protein gradient in order to attempt to make axonal growth accelerate. Ultimately, these gradients could be applied to peripheral nerve regeneration in which researchers would make a nerve grow through tissue scaffold. Results The regression equation is Concentration1 = 0.272 + 0.00286 Distance1 S = 0.501831 R2 = 66.2% R2(adj) = 66.2% After removing outliers: The regression equation is Concentration2 = 0.255 + 0.00271 Distance2 S = 0.251293 R2 = 87.6% R2(adj) = 87.6% F1,1218,0.999 < F1,120,0.999 = 11.38 < 2385.61 = F Figure 3: F Distribution MINITAB Analysis of Variance Source DF SS MS F P Regression 1 600.78 600.78 2385.61 0.000 Residual Error 1218 306.73 0.25 Total 1219 907.51 Figure 2: Scatter Plot of Data Data Explained The data can best be explained from the picture below. The variable X represents the distance from the edge of the cover slip. The variable Y represents the protein concentration at a measured point. Again, the goal was to create a linear regression of protein concentration where protein concentration increased as the distance X from the edge of the cover slip increased. The data consisted of 1220 data points. Figure 1: Protein Gradient on Cover Slip Conclusion The results are summarized in an Analysis of Variance table from using the MINITAB REGRESSION program. F > F1,1218,0.99 and therefore p < 0.001.The null hypothesis H0 then can be rejected and therefore the alternative hypothesis is accepted, which states that the slope of the regression line is significantly different from zero. This implies that there is a significant linear relationship between distance from the edge of the cover slip and protein concentration. This protein gradient is ready for further experimentation in peripheral nerve regeneration.