Download
1 / 23
240 likes | 429 Views
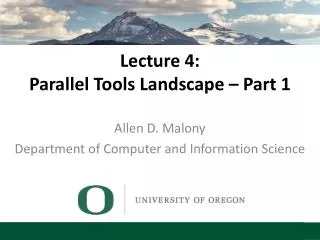
Lecture 4: Parallel Tools Landscape – Part 1. Allen D. Malony Department of Computer and Information Science. Tools and Technologies. PAPI Dyninst binary instrumenter , StackwalkerAPI , MRNet Scalasca and Score-P Periscope mpiP Open|SpeedShop , Stat Prophesy and MuMMI HPCToolkit

E N D
Lecture 4:Parallel Tools Landscape – Part 1 Allen D. Malony Department of Computer and Information Science
Tools and Technologies • PAPI • Dyninst • binary instrumenter, StackwalkerAPI, MRNet • Scalasca and Score-P • Periscope • mpiP • Open|SpeedShop, Stat • Prophesy and MuMMI • HPCToolkit • Vtune • Active Harmony • Orio and Pbound • PerfExpert • MAQAO • Vampir • Paraver Parallel Performance Tools: A Short Course, Beihang University, December 2-4, 2013
Timer: gettimeofday() • UNIX function • Returns wall-clock time in seconds and microseconds • Actual resolution is hardware-dependent • Base value is 00:00 UTC, January 1, 1970 • Some implementations also return the timezone #include <sys/time.h> structtimevaltv; double walltime; /* seconds */ gettimeofday(&tv, NULL); walltime = tv.tv_sec + tv.tv_usec * 1.0e-6;
Timer: clock_gettime() • POSIX function • For clock_id CLOCK_REALTIMEreturns wall-clock time in seconds and nanoseconds • More clocks may be implemented but are not standardized • Actual resolution is hardware-dependent #include <time.h> structtimespectv; double walltime; /* seconds */ Clock_gettime(CLOCK_REALTIME, &tv); walltime = tv.tv_sec + tv.tv_nsec * 1.0e-9;
Timer: getrusage() • UNIX function • Provides a variety of different information • Including user time, system time, memory usage, page faults, etc. • Information provided system-dependent! #include <sys/resource.h> structrusageru; double usrtime; /* seconds */ intmemused; getrusage(RUSAGE_SELF, &ru); usrtime = ru.ru_utime.tv_sec +ru.ru_utime.tv_usec * 1.0e-6;memused = ru.ru_maxrss;
Timer: Others • MPI provides portable MPI wall-clock timer • Not required to be consistent/synchronized across ranks! • OpenMP 2.0 also provides a library function • Hybrid MPI/OpenMP programming? • Interactions between both standards (yet) undefined #include <mpi.h> double walltime; /* seconds */ walltime = MPI_Wtime(); #include <omp.h> double walltime; /* seconds */ walltime = omp_get_wtime();
Timer: Others • Fortran 90 intrinsic subroutines • cpu_time() • system_clock() • Hardware Counter Libraries • Vendor APIs • PMAPI, HWPC, libhpm, libpfm, libperf, … • PAPI
What Are Performance Counters • Extra processor logic inserted to count specific events • Updated at every cycle • Strengths • Non-intrusive • Very accurate • Low overhead • Weaknesses • Provides only hard counts • Specific for each processor • Access is not appropriate for the end usernor well documented • Lack of standard on what is counted
Hardware Counter Issues • Kernel level • Handling of overflows • Thread accumulation • Thread migration • State inheritance • Multiplexing • Overhead • Atomicity • Multi-platform interfaces • Performance API (PAPI) • University of Tennessee, USA • LIKWID • University of Erlangen, Germany Multi platform interface Kernel Hardware counters Parallel Performance Tools: A Short Course, Beihang University, December 2-4, 2013
Hardware Measurement • Typical measured events account for: • Functional units status • float point operations • fixed point operations • load/stores • Access to memory hierarchy • Cache coherence protocol events • Cycles and instructions counts • Speculative execution information • instructions dispatched • branches mispredicted
Hardware Metrics • Typical hardware counter Useful derived metrics • Cycles / Instructions IPC • Floating point instructions FLOPS • Integer instructions computation intensity • Load/stores instructions per load/store • Cache misses load/stores per cache miss • Cache misses cache hit rate • Cache misses loads per load miss • TLB misses loads per TLB miss • Derived metrics allow users to correlate the behavior of the application to hardware components • Define threshold values acceptable for metrics and take actions regarding optimization when below/above thresholds
Accuracy Issues • Granularity of the measured code • If not sufficiently large enough, overhead of the counter interfaces may dominate • Pay attention to what is not measured: • Out-of-order processors • Sometimes speculation is included • Lack of standard on what is counted • Microbenchmarks can help determine accuracyof the hardware counters
Hardware Counters Access on Linux • Linux had not defined an out-of-the-box interface to access the hardware counters! • Linux Performance Monitoring Counters Driver (PerfCtr)by MikaelPettersson from Uppsala X86 + X86-64 • Needs kernel patching! • http://user.it.uu.se/~mikpe/linux/perfctr/ • Perfmon by StephaneEranian from HP – IA64 • It was being evaluated to be added to Linux • http://www.hpl.hp.com/research/linux/perfmon/ • Linux 2.6.31 • Performance Counter subsystem provides an abstraction of special performance counter hardware registers
Utilities to Count Hardware Events • There are utilities that start a program and at the end of the execution provide overall event counts • hpmcount (IBM) • CrayPat (Cray) • pfmon from HP (part of Perfmon for AI64) • psrun (NCSA) • cputrack, har (Sun) • perfex, ssrun (SGI) • perf (Linux 2.6.31)
PAPI – Performance API • Middleware to provide a consistent programming interface for the performance counter hardware in microprocessors • Countable events are defined in two ways: • Platform-neutral preset events • Platform-dependent native events • Presets can be derived from multiple native events • Two interfaces to the underlying counter hardware: • High-level interface simply provides the ability to start, stop and read the counters for a specified list of events • Low-level interface manages hardware events in user defined groups called EventSets • Events can be multiplexed if counters are limited • http://icl.cs.utk.edu/papi/
PAPI Low Level Portable Layer PAPI MachineDependentSubstrate PAPI Architecture Tools PAPI High Level Machine Specific Layer Kernel Extensions Operating System Hardware Performance Counters
PAPI Predefined Events • Common set of events deemed relevant and usefulfor application performance tuning (wish list) • papiStdEventDefs.h • Accesses to the memory hierarchy, cache coherence protocol events, cycle and instruction counts, functional unit and pipeline status • Run PAPI papi_avail utility to determine which predefined events are available on a given platform • Semantics may differ on different platforms! • PAPI also provides access to native events on all supported platforms through the low-level interface • Run PAPI papi_native_avail utility to determine which predefined events are available on a given platform
papi_availUtility % papi_avail -h This is the PAPI avail program. It provides availability and detail information for PAPI preset and native events. Usage: papi_avail [options] [event name] papi_avail TESTS_QUIET Options: -a display only available PAPI preset events -d display PAPI preset event info in detailed format -e EVENTNAME display full detail for named preset or native event -h print this help message -t display PAPI preset event info in tabular format (default)
High Level API • Meant for application programmers wantingsimple but accurate measurements • Calls the lower level API • Allows only PAPI preset events • Eight functions: • PAPI_num_counters • PAPI_start_counters, PAPI_stop_counters • PAPI_read_counters • PAPI_accum_counters • PAPI_flops • PAPI_flips, PAPI_ipc (New in Version 3.x) • Not thread-safe (Version 2.x)
Low Level API • Increased efficiency and functionalityover the high level PAPI interface • 54 functions • Access to native events • Obtain information aboutthe executable, the hardware, and memory • Set options for multiplexingand overflow handling • System V style sampling (profil()) • Thread safe
Developer API Developer API PAPI COMPONENT (Network) PAPI COMPONENT (System Health) Operating System Operating System Counter Hardware Counter Hardware Component PAPI Low Level User API High Level User API PAPI FRAMEWORK Developer API PAPI COMPONENT (CPU) Operating System Counter Hardware
PAPI CUDA Component • HW performance counter measurement technology for NVIDIA CUDA platform • Access to HW counters inside the GPUs • Based on CUPTI (CUDA Performance Tool Interface) • PAPI CUDA component can provide detailed performance counter info regarding execution of GPU kernel • Initialization, device management and context management are enabled by CUDA driver API • Domain and event management are enabled by CUPTI • Names of events are established by the following hierarchy:Component.Device.Domain.Event Parallel Performance Tools: A Short Course, Beihang University, December 2-4, 2013
Portion of CUDA Events on Tesla C870 Parallel Performance Tools: A Short Course, Beihang University, December 2-4, 2013