Download
1 / 31
310 likes | 325 Views
Discover essential software tools for sustainable energy planning, learn how to address technical issues unique to your community, and harmonize energy strategies for SMART ENERGY CITIES development.

E N D
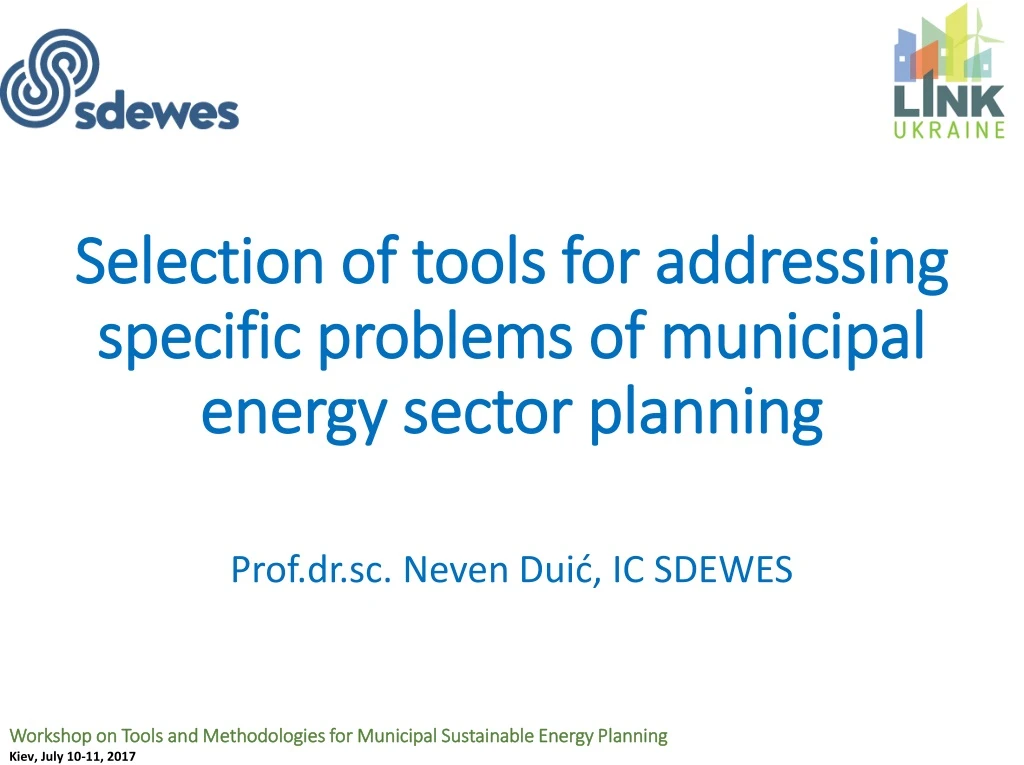
Selection of tools for addressing specific problems of municipal energy sector planning Prof.dr.sc. Neven Duić, IC SDEWES Workshop on Tools and Methodologies for Municipal Sustainable Energy Planning Kiev, July 10-11, 2017
Do we need energy planning? YES • Long investment cycles • Integration of power, heating, cooling, transport, water • Solve technical issues particular to your community • Build arguments and have answers to all criticism • Accounting for SEAPs, strategies, budgets etc.
Which tools? • A review of computer tools for analysing the integration of renewable energy into various energy systems, D.Connolly, H.Lund, B.V.Mathiesen, M.Leahy, https://doi.org/10.1016/j.apenergy.2009.09.026 • ICLEI, LEAP, GIS, EnergyPLAN, Dispaset, Retscreen, Markal/TIMES, PLEXOS, GIS tools, MATLAB, EnergyPRO, H2RES ….
Which tools? • Long term accounting, penetration of new technologies and phase out of old: • LEAP easy, good for communities • Markal/TIMES hard • Technical simulation, how does one technology work with the system: • EnergyPLAN easy • Distributed planning, for example heating system, roof PV, grids: • GIS family of tools
Next step: Harmonisation of SECAPs & SUMPs = SMART ENERGY CITIES Development of Covenant of Mayors Initiative • The harmonisation should focus on the following aspects: • Creation of a joint database gathering data on energy, environment, climate and mobility • Harmonisation of the plans’ timeframes, namely their reference years and the timing of their monitoring • Definition of common indicators • Joint management of participatory processes (i.e. the involvement of stakeholders) • Electric mobility, which is one of the main joining links between SEAPs and SUMPs and therefore the area that should be developed the most, together with the production of electricity from renewable energy sources Sources: http://www.covenantofmayors.eu, http://www.eltis.org/mobility-plans, http://www.simpla-project.eu
Assessment of the current situation • ICLEI Europe's Basic Greenhouse Gas Inventory Quantification Tool • Energy consumption and Baseline emissions inventory • Excel sheets which are used to calculate overall energy consumption and quantify greenhouse gas emissions • Divided into government and community sectors • Government sectors: Buildings, Vehicles, Public Lighting, Water and Sewage, Waste management • Community sectors: Residential, Commercial, Industry, Transportation, Waste, Agriculture, Local Energy Production • Tool automatically calculates energy consumption in MWh and emissions in tCO2e • Available for free to: • Local government • Regional government • Local / regional energy agency • Local government association / networks • http://www.iclei-europe.org/ccp/basic-climate-toolkit/ Source: www.iclei-europe.org/ccp/basic-climate-toolkit/
Assessment of the current situation Source: www.iclei-europe.org/ccp/basic-climate-toolkit/
Vision and Action Plan development Setting up goals and targets: • Specific • Measurable • Achievable • Realistic • Time-Bounded Choice of measures and scenarios based on Best Practice Examples Development of scenarios using energy planning tools: • EnergyPLAN • Homer • H2RES • LEAP, … Prioritisationof measures implementation: • Decision makers choice • Stakeholders decision • Analysis using: • Marginal Cost Abatement Curve • Pareto line • Multi criteria analysis Source: http://www.covenantofmayors.eu, F. Levihn, “On the problem of optimizing through least cost per unit, when costs are negative: Implications for cost curves and the definition of economic efficiency,” Energy, vol. 114, pp. 1155–1163, 2016.
Integral energy planning • Modeling long term energy demand is the first step towards advanced energy systems and their analysis since its results presents one of the key input data used for energy systems optimization • It is crucial to analyze and quantify all influencing mechanisms (demography, economy, policy, learning curves etc. ) • Transition to low carbon society will mean life in energy neutral buildings, integrated electric vehicles etc.
Integral energy planning 2020, 2030, 2040, 2050…….
Integral energy planning • SOURCE: International Energy Agency
Long term energy demand modelling • Classical energy demand planning is usually focused on establishing relationship between economic variables energy consumption • This is usually done based on analyzing different historical data and processing them in a relatively simple way • It is argued that this approach has become inefficient in the case of EU countries which strive towards decoupling their economic growth and energy consumption.
Long term energy demand modelling Croatia Denmark
Long term energy demand modelling approaches • Energy demand modeling and forecasting can be divided into several approaches and philosophies: • Simple approach (trend line analysis) • Sophisticated approach • Econometric • End-use • Input-output • Accounting frameworks • Hybrid
Long term energy demand modelling approaches – accounting frameworks Rather than simulating decisions of energy consumers and producers, modeler explicitly accounts for outcomes of decisions Accounting Frameworks simply examine the implications of a scenario that achieves a certain market share. Example: “What will be the costs, emissions reductions and fuel savings if we invest in more energy efficiency & renewables vs. investing in new power plants?” Examples: LEAP
Long term energy demand modelling approaches – LEAP Long range Energy Alternatives Planning System • Accounting framework, user-friendly, scenario-based, integrated energy-environment model-building tool. • Scope: energy demand, energy supply, resources, environmental loadings, cost-benefit analysis, non-energy sector emissions. Most aspects optional. • Time: medium to long-term, annual time-step, unlimited number of years.
Long term energy demand modelling approaches – LEAP • Flexible Approach to Modeling: basic relationships are all based on non-controversial physical accounting. • Data requirements: flexible, low initial data requirements.Includes TED database, with technical characteristics, costs and emission factors of ~ 1000 energy technologies. • Geographic Applicability: local, national, regional.
1 000 500 Efficiency Avoided supply-side investment measures Difference 0 Generation Additional demand-side billion dollars (2000) investment Transmission - 500 -1 000 Distribution -1 500 -2 000 Long term energy demand modelling approaches – LEAP • Source WEO 2004 Difference in Electricity Investment in the Alternative vs. Reference Scenario 2003-2030
The EnergyPLAN Model: Energy System Analysis Model with the focus on comparing different regulation systems ability to integrate variable renewable energy sources Simplified modelling of energy system: Inputs from demand (hourly electricity, heat, cooling demands, aggregated yearly demands in various sectors) and supply side (installed capacities of production units, hourly distributions for RES) Yearly, monthly and hourly values of electicity production, import/export balances, critical excess production , share of RES, CO2 emissions
Integrating solar production – limiting CEEP Solar and wind production – variable sources Increasing the solar PV integration in various scenarios – different demand response technologies Up to 2000 MW of Solar PV can be integrated with limited CEEP! • DEMAND RESPONSE: • Electric vehicles in vehicle-to-grid concept • Flexible power plants operation • Power-to-heat
The Dispa-SET model • Execution flowchart Sim template: 34 Excel sheets (Ignacio’s model) Data Template: Mysqldatabase Results template: 1 excelsheetwith BOTH the inputs and the results Raw data: csv sheetsfrom the TSO Sim template: GDX file Sim template: Python Format Raw data processing: • Read csv sheets, assemble data • Convert to the right format (timestep, units, etc). • Define proper time index (duplicates not allowed) • Connect to database • Check if data is present & write it down • Write metadata Conversion tool: Python GAMS Dos/Batch
GIS tools for use by municipalities • Commercial tools • ArcGIS • Free tools • qGIS • Custom made solutions • Geoportal, GIS based building census…
Examples of GIS development in Croatia • Example, city of Velika Gorica in Croatia • GIS map of all individual buildings classified based on their heating demand • Additional info including height, type and surface area
Examples of GIS development in Croatia • Example, city of Velika Gorica in Croatia • GIS map of the DH and natural gas infrastructure • Useful analysis and future planning • DH and natural gas overlap!!!
Examples of GIS development in Croatia • Example, city of Velika Gorica in Croatia • Heat demand GIS map calculated using the building data (100X100 meters) • Demonstration of high centres of heat demand suitable for DH expansion
Examples of GIS development in Croatia • Example, city of Velika Gorica in Croatia • GIS analysis of suitable location for DH based on cost and price of heat and existing infrastructure • It is possible to group centres of high demand and exclude outliers
Examples of GIS development in Croatia • Example, city of Zagreb in Croatia • Capital city, large DH grid • GIS map of cooling demand with highlighted potential consumers and existing as well as planned infrastructure • Developed with DC in mind
GIS tools for use by municipalities • The use of GIS allows for precise and integrated city planning • Sinergy between city offices and departments • Easy and quick access to vital information in one place • Can be used for the planning and optimisation of some activities such as waste collection • From an energy perspective – better spatial matching of supply and demand • Quality is highly dependent on the availability of data