Download
1 / 48
480 likes | 646 Views
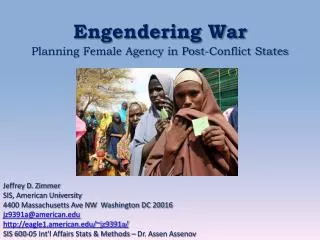
Engendering agricultural censuses, Experience from Africa. Diana Tempelman Senior Officer, Gender and Development FAO Regional Office for Africa, Accra. “Global Forum on Gender Statistics” Accra, 26 - 29 January 2009. GENDER CONCERNS IN AGRICULTURAL SECTOR.

E N D
Engendering agricultural censuses, Experience from Africa Diana Tempelman Senior Officer, Gender and Development FAO Regional Office for Africa, Accra “Global Forum on Gender Statistics” Accra, 26 - 29 January 2009
GENDER CONCERNS IN AGRICULTURAL SECTOR • Male dominated rural out-migration • Access to productive resources:land & animals • Access to agricultural inputs:seeds, fertilizer / agro-chemicals, extension / training, finances, farmers organisations (market-)information • Access to / provision of family labour • Responsibilities
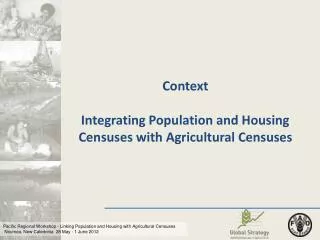
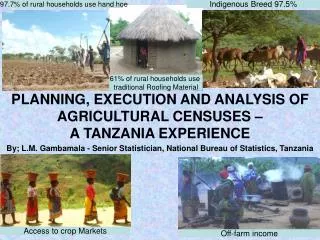
Engendering agricultural statisticsOutline of presentation • Early days – first half 1990-ies • Developing methodology- WCA 2000 (1996-2005) • Consolidation- WCA 2010(2006 – 2015) • Remaining challenges * WCA = World Census of agriculture
Early REACTIONS Early days – first half 1990-ies “Those feminists from Beijing!” Thought? Thought? “Yes, women’s agricultural work doesn’t show in statistics”
ACTIONS Early days – first half 1990-ies • re-analysing existing raw data • data by sex of Head of Holding • technical support touser-producers workshopsavailability / demand / users of • sex-disaggregated agricultural data • revision of concepts & definitions
OUTCOME Early days – first half 1990-ies • Awareness on need for sex-disaggregated data • Knowledge among statisticians • Openness to test collection sex-disaggregated data through existing agricultural surveys / censuses
ACTIONS Developing a methodology:WCA 2000(1996-2005) Gender analysis training Data analysis & presentation at sub-national level Data presentation at sub-household level ALL MEMBERS’ WORK
Guinea – Labé Region Guinea 85+ 85+ 80 - 84 80 - 84 75 - 79 75 - 79 70 -74 70 -74 65 - 69 65 - 69 60 - 64 60 - 64 55 - 59 55 - 59 50 - 54 50 - 54 45 - 49 45 - 49 40 - 44 40 - 44 35 - 39 35 - 39 30 - 34 30 - 34 25 - 29 25 - 29 20 - 24 20 - 24 15 -19 15 -19 .10 - 14 .10 - 14 .5 - 9 .5 - 9 > 5 > 5 Male Male Female Female Scale maximum = 90000 Scale maximum = 800000 DATA FEMINISATION AGRICULTURAL SECTOR
DATA feminisation of agriculture Heads of agricultural holdings / sex in selected provinces - CAMEROON
DATA labour constraints in headed HH Active male members / sex of HoHH, Tanzania
DATA “Gender” variation at sub-national level Area under maize, NIGER
DATA “Gender” variation at sub-national level area under vouandzou, NIGER
DATA Under - presentation of women farmers’ work Area cultivated / crop by sex of agricultural holder– BURKINA FASO
DATA Enhanced presentation of women farmers’ work Area cultivated / crop by sex of agricultural holder & sub-holder NEW CONCEPT > PLOT-MANAGERS
OUTCOME Developing a methodology:WCA 2000(1996-2005) Lessons learned document
OUTCOME 2. Developing a methodology:WCA 2000(1996-2005) Thematic census reports: Tanzania, Niger
EXAMPLES of Best practisesfrom WCA 2010 • Analysis of demographic data • Access to productive resources (/ sex of HoHH & individual) • Destination of agricultural produce / sex of HoHH (min.) • Credit, labour and time-use • Poverty indicators
DATA i - Demographic data - NIGER Average size and dependency ratio of agricultural households by sex of Head of Household at regional and national level Source: RGAC 2004-2007, Niger
DATA LAND Collective management / Head of HH
DATA LAND Individual management / active HH members
DATA Agricultural HH / principal activity / sex HoHH, Niger Source: RGAC 2004-2007, Niger
ii - Access to productive resources: ANIMALS Household level question
DATA Sedentary animals / type of animal / sex of owner, Niger Source: RGAC 2004-2007, Niger
DATA Ownership chicken / sex of owner, Niger Source: RGAC 2004-2007, Niger
DATA Ownership pigeons / sex & age of owner, Niger Source: RGAC 2004-2007, Niger
iii – destination of agricultural produce Part 2 – Crop usage proportions (percentages) ETHIOPIA
DATA Destination of birds / sex of HoHH, Niger Source: RGAC 2004-2007, Niger
iv – Credit, labour, time-use. Tanzania Q 13.1: During the year 2002/2003 did any of the household members borrow money for agriculture? Yes or no Q 13.2 If yes, then give details of the credit obtained during the agricultural year 2002/2003 (if the credit was provided in kind, for example by the provision of inputs, then estimate the value)
DATA Female HoHH use credit to hire labour - to purchase seeds TANZANIA
Reasons for not receiving a loan or credit - UGANDA Source: Uganda – Pilot Census of Agriculture 2003 – PCA Form 2: Section 2.2
iv Time-use, Ethiopia Source: Ethiopian Agricultural Sample Enumeration Miscellaneous Questions – 2001/02 (1994 E.C.) 21 How much time do men and women spend in the household on each of the following agricultural activities? Use the codes given below the table Codes: 1 = Not participated 2 = One fourth of the time (1/4) 3 = One half of the time (1/2) 4 = Three fourth of the time (3/4) 5 = Full time 6 = Not applicable
DATA iv - Division of Labour, Tanzania
V – Poverty indicators, Tanzania Source: United Republic of Tanzania – Agricultural Sample Census 2002/2003- Small holder/Small Scale Farmer Questionnaire: Section 34
DATA Frequency of food shortages, Tanzania A higher percent male-headed HHs never has food shortage. A higher percent of female-headed HHs has often or always food shortages. The same pattern appears in the regions.
ACTIONS Consolidation phase WCA 2010 (2006 – 2015) Integration into: FAO STATISTICAL DEVELOPMENT SERIES
ACTIONS Consolidation – WCA 2010 (2006 – 2015) Forthcoming
ACTIONS Consolidation – WCA 2010 (2006 – 2015) Reinforcing sex-disaggregated data in COUNTRY STAT
Discussion points Remaining challenges • analysis of available sex-disaggregated data • usesex-disaggregated data – policy-making, implementation & impact assessment
Discussion points Remaining challenges • integration national statistical systems • Progress & impact indicators
Discussion points Remaining challenges IMPROVED DATA COLLECTION • Labour • Decision-making • Responsibilities