Download

1 / 41
440 likes | 911 Views
NATIONAL PHENOLOGY NETWORK (NPN). Challenges of Building a Phenological Research Infrastructure in the USA. Research Contributions. Research Collaborators: R. Ahas, A. Aasa, X. Chen, B. Reed, M. White, and T. Zhao Phenology data from J. Caprio, DWD, and A. Menzel

E N D
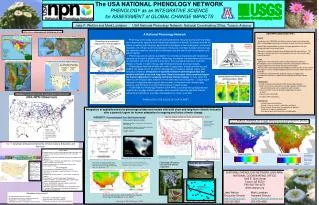
NATIONAL PHENOLOGY NETWORK (NPN) Challenges of Building a Phenological Research Infrastructure in the USA
Research Contributions • Research Collaborators: R. Ahas, A. Aasa, X. Chen, B. Reed, M. White, and T. Zhao • Phenology data from J. Caprio, DWD, and A. Menzel • Climate data from Chinese Meteorological Administration, German Weather Service (DWD), Instytut Meteorologii i Gospodarki Wodnej(Poland), and USA National Climatic Data Center • NSF Grants ATM-9510342, 9809460, and 0085224 • Base maps from ESRI data
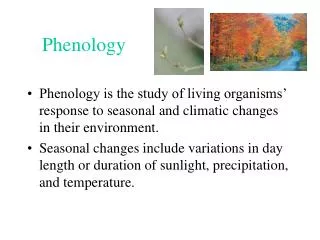
Definition of Phenology • Phenologywhich is derived from the Greek word phaino meaning to show or to appear, is the study of plant and animal life cycle events, which are triggered by environmental changes, especially temperature. Thus, timings of phenological events are ideal indicators of global change impacts. • Seasonality is a related term, referring to similar non-biological events, such as timing of the fall formation and spring break-up of ice on fresh water lakes.
Phenological Research • Traditional approach: agriculture-centered, and local-scale events • Recent approach: Earth systems interactions, and global-scale events • Question: What roles for phenology in current and future agricultural research?
Decadal Averaged Cherry Bloom in Kyoto, Japan Data Source: web file (no longer available)
Mean onset of spring phenophases in the International Phenological Gardens (Europe) Source: Menzel et al. 2001, Global Change Biology, Figure 1
Cloned lilac first leaf and first bloom datesat a single station in Vermont
Simulated phenology developed from lilac and honeysuckle data combined with climate data Source: Schwartz and Reiter 2000, Plate 4 (updated)
Critical Research Areas • Atmosphere-Biosphere Interactions • Long-term Organism response to Climate Change • Global Phenology Databases for monitoring and management
Integrated Approach • Satellite Observations (AVHRR-NDVI) • Indicator Species Phenology • Native Species Phenology
DMA NDVI Start of Season 1995(Schwartz et al. 2002, mean day = 74, March 15th)
Critical Research Areas • Atmosphere-Biosphere Interactions • Long-term Organism response to Climate Change • Global Phenology Databases for monitoring and management
Diurnal Range Change with Lilac First Leaf Source: Schwartz 1996, Figure 3
Critical Research Areas • Atmosphere-Biosphere Interactions • Long-term Organism response to Climate Change • Global Phenology Databases for monitoring and management
Terrestrial Biosphere Dynamic Change Detection • Satellite Phenology • Simulated Phenology (Models) • Cloned Species Phenology • Native Species Phenology
Satellite Phenology • Advantages: 1) Global coverage; 2) Integrated signal • Limitations: 1) Short period-of-record; 2) Cloud cover interference; 3) Interpretation issues; 4) Small set of measures
SMN NDVI Start of Season 1995 (Schwartz et al. 2002, mean day = 124, May 4th)
Simulated Phenology • Advantages: 1) Broad coverage if using simple input; 2) Standardized response • Limitations: 1) Model inadequacies; 2) Small set of events and plants
Spring Indices Suite of Measures • First -2.2oC freeze date in Autumn • Composite chill date (SI models) • First leaf date (SI models) • First bloom date (SI models) • Last -2.2oC freeze date in Spring • -2.2oC Freeze period • Damage index value (first leaf – last frost) • Average annual, average seasonal, and twelve average monthly temperatures
Cloned Species Phenology • Advantages: 1) Ideal for model development; 2) Standardized response to environment; 3) Broad range • Limitations: 1) Lack of network geographical coverage; 2) Not adapted to local environment
Native Species Phenology • Advantages: 1) Adapted to the local environment; 2) Precise signal • Limitations: 1) Lack of network geographical coverage; 2) Limited range; 3) Geographical variations in response
Integrated ApproachExample: WisconsinZhao and Schwartz (2003) • Satellite phenology (DMA SOS) • Simulated phenology (SI first bloom dates) • “Native” species phenology (WPS records of first bloom date for 21 introduced and 32 native species)
Critical Research Areas • Atmosphere-Biosphere Interactions • Long-term Organism response to Climate Change • Global Phenology Databases for monitoring and management
Critical Data/Analysis Needs • Interpretation/Comparison of satellite phenology with “spatial” surface data • Interpretation of “ripple effects” in biomes and managed systems • National, continental, and global scale phenology networks
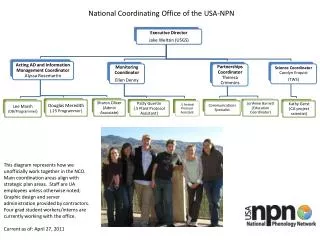
USA National Phenology Network (NPN) • a continental-scale network observing regionally appropriate native plant species, cloned indicator plants (lilac), (and selected agricultural crops?) • designed to complement remote sensing observations • data collected will be freely available to the research community and general public
What might be possible with 20 years (or less) of phenological data? • Facilitate understanding of plant phenological cycles and their relationship to climate • Comprehensive evaluation of satellite-derived measurements • Detection of long-term phenological trends in response to climate variability/global warming • Evaluate impacts of longer growing seasons on pollinators, cattle, crop and forest pests, wildfires, carbon storage, and water use
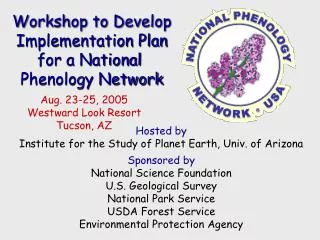
Issues for NPN Implementation Workshop (Aug. 23-25, 2005 in Tucson, AZ) • Native species selection for regions • Expansion of indicator plants to entire country • Web-based reporting and feedback system • Network infrastructure design and function • Collaborative and cooperative agreements • Deployment and development strategies • Public engagement and awareness