Download
1 / 4
40 likes | 223 Views
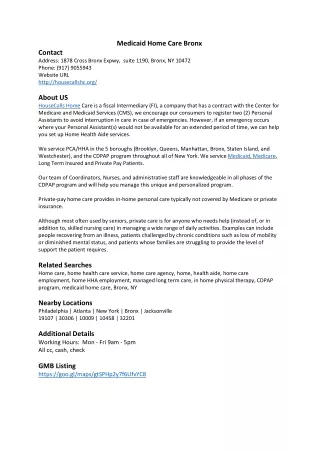
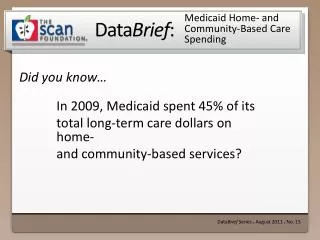
Medicaid Home- and Community-Based Care Spending. Data Brief Series ● August 2011 ● No. 15. In 2009, Medicaid spent 45% of its total long-term care dollars on home- and community-based services?. Medicaid Home- and Community-Based Care Spending .

E N D
Medicaid Home- and Community-Based Care Spending DataBrief Series ● August 2011 ● No. 15 In 2009, Medicaid spent 45% of its total long-term care dollars on home- and community-based services?
Medicaid Home- and Community-Based Care Spending • Medicaid is the largest single payer of long-term care (LTC) in the United States.1 In 2009, Medicaid spent $114 billion on LTC, which was 32% of total Medicaid spending.2 • Under federal statute, state Medicaid programs are required to cover nursing home services and limited home health services. However, the statute provides states with the option to cover additional home- and community-based services (HCBS) through HCBS waiver programs, the personal care optional benefit, expanded home health care, and amendments to state Medicaid plans. • Between 1999 and 2009, national Medicaid spending on HCBS grew from $17 billion* to $51 billion; during that same timeframe, the percent of national Medicaid LTC spending on HCBS grew from 27%* to 45%.2 • In 2009, Medicaid HCBS spending as a percent of all Medicaid LTC spending ranged from 15% in Mississippi to over 80% in New Mexico.2 1 The SCAN Foundation (2011). DataBrief No. 13: Sources of Long-Term Care Spending. Accessed on February 22, 2011 at: http://www.TheSCANFoundation.org/foundation-publications/databrief-no-13-sources-long-term-care-spending 2 Analysis of data from the CMS Form 64 performed by Eiken, S., Sredl, K., Burwell, B., Gold, L. “Medicaid Long-Term Care Expenditures, FY 2009.” HCBS ClearingHouse, August 2010. http://hcbs.org/moreInfo.php/nb/doc/3325/Medicaid_Long_Term_Care_Expenditures_FY_2009 * The 1999 Medicaid HCBS spending does not include spending on the PACE program and HCBS spending authorized under Sections 1115, 1915(j), and 1929 of the Social Security Act. DataBrief (2011) ● No. 15
WA ME VT MT ND NH MN OR MA WI NY ID CT RI SD MI WY PA NJ IA NE DE OH NV IL IN MD WV UT VA D.C. CA CO MO KY KS NC TN OK SC AZ AR NM MS AL GA LA TX AK FL HI HCBS Spending as a Percent of MedicaidLong-Term Care Spending By State, 20091 50%+ 40% to 49.9% 30% to 39.9% <30% Source: Analysis of data from the CMS Form 64 performed by Eiken, S., Sredl, K., Burwell, B., Gold, L. “Medicaid Long-Term Care Expenditures, FY 2009.” HCBS ClearingHouse, August 2010. http://hcbs.org/moreInfo.php/nb/doc/3325/Medicaid_Long_Term_Care_Expenditures_FY_2009 1 HCBS spending includes HCBS expenditures authorized under Sections 1915(c) and 1915(j) of the Social Security Act including MR/DD; the home health benefit; the optional personal care benefit; the Program of All Inclusive Care for the Elderly; and select HCBS expenditures authorized under Section 1115 of the Social Security Act. It does not include HCBS spending under Section 1915(i) of the Social Security Act, spending through managed care programs, or spending authorized under Section 1115 that was not clearly allocated to community-based long-term care.Reliable fee-for-service data do not exist for Arizona and Vermont. DataBrief (2011) ● No. 15
A Clear Policy Connection Over the past three decades, there has been bipartisan support for policies encouraging growth and expansion of home- and communiy-based LTC, the care setting many people prefer. Today, however, states are facing significant budget challenges leaving HCBS vulnerable to Medicaid cuts. Currently, over half of the states have cut funding for services needed by low-income older and disabled Americans, which has resulted in some HCBS service reductions and longer waiting lists.1 While state cuts ensue, the federal government continues to encourage adoption and expansion of services that allow older and disabled Americans to remain in the community. The Affordable Care Act (ACA) includes provisions seeking robust HCBS growth. The State Balancing Incentives provision in the ACA offers additional federal funding to low-spend HCBS states that take action toward increasing HCBS service offerings. In addition, the ACA provides funding to help institutionalized Medicaid beneficiaries transition to the community through the Money Follows the Person Demonstration program and the Community First Choice Option. The ACA also allows states to offer HCBS as a Medicaid state plan option by revising section 1915(i) of the Social Security Act. • The findings in this analysis are based on the CMS Form 64 data published by Thomson Reuters, which detail each state’s Medicaid expenditures. • In this analysis, HCBS spending is defined as HCBS expenditures authorized under Sections 1915(c) and 1915(j) of the Social Security Act; the home health benefit; the optional personal care benefit; the Program of All Inclusive Care for the Elderly; and select HCBS spending authorized under Section 1115 of the Social Security Act. Under Section 1115, states can cover acute care or LTC, but the data include only Section 1115 spending that was clearly allocated to HCBS programs. HCBS expenditures authorized under Section 1915(i) of the Social Security Act are also not included. • Many managed care programs that provide LTC are not represented in the CMS-64. Therefore, spending on HCBS forCalifornia, Florida, Hawaii, Kansas, Massachusetts, New Mexico, New York, Tennessee, Texas, and Wisconsin may be understated. Most of Arizona’s and Vermont’s LTC spending is either through managed care programs or Section 1115 waivers that cannot clearly be allocated to HCBS. Because of this, neither states’ spending is fully captured by the CMS 64. 1 Johnson, Nicholas, Phil Oliff and Erica Williams. “An Update on State Budget Cuts: At Least 46 States Have Imposed Cuts That Hurt Vulnerable Residents and the Economy.” February 2011 http://www.cbpp.org/cms/index.cfm?fa=view&id=1214 DataBrief (2011) ● No. 15