Download
1 / 32
320 likes | 404 Views
Explore the causes and impact of the 2010 Haiti earthquake, examining tectonic influences and aftershocks. Discover detailed maps and seismic data revealing the earthquake's magnitude and fault lines.

E N D
Credit Digital Globe Page created by W. G. Huang
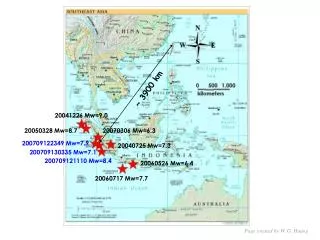
Earthquake Parameters 2010-01-12 at 21:53:10.4 UTC 18.47 N ; 72.55 W Mw=7.1; Depth=10 km Taiwan Page created by W. G. Huang
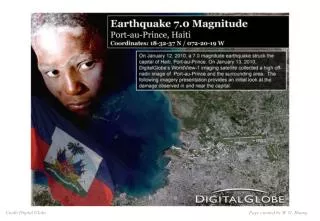
Earthquake Parameters 2010-01-12 at 21:53:10.4 UTC 18.47 N ; 72.55 W Mw=7.1; Depth=10 km Page created by W. G. Huang
The USGS reported that the earthquakes occurred along the boundary between the Caribbean and North America plates. The two tectonic plates meet at a strike-slip fault, with the Caribbean plate moving eastward with respect to the North America plate. The January 12 earthquake was the worst to strike the region in decades, and possibly well over a century. 菲律賓板塊 Philippines 歐亞板塊 Eurasian 北美板塊 North American 加勒比海板塊 Caribbean 太平洋板塊 Pacific 太平洋板塊 Pacific 非洲板塊 African 印度-澳洲板塊 Indian/Australian 南美板塊 South American 南極板塊 Antarctica 納薩卡板塊 Nazca Page created by W. G. Huang
This map shows the topography and tectonic influences in the region of the earthquake. Ocean areas appear in shades of blue, and land areas appear in shades of brown. Lighter colors indicate higher elevation on land and shallower depth in the water. Black circles mark earthquake locations determined by the USGS, and circle sizes correspond with quake magnitudes. Dozens of aftershocks followed the main quake. Red lines indicate fault lines. 7.0 Quake Near Port Au Prince Credit NASA Page created by W. G. Huang
The epicenter of the quake appears just south of the Enriquillo-Plaintain Garden Fault, the southernmost of two major east-west-trending faults that bear the stress of the convergence of the Caribbean and North America tectonic plates in this location. Though faults are weak spots or fractures in the Earth’s crust below the surface, very often there are topographical clues to their presence. In this case, the presence of the fault is indicated by long, straight valley cutting through southern Haiti, just south of Port-Au-Prince. 7.0 Quake Near Port Au Prince Credit NASA Page created by W. G. Huang
Credit iMMAP Page created by W. G. Huang
Haiti Overview Map Port au Prince and Surrounding Areas Page created by W. G. Huang
Intensity Map Credit USAID Page created by W. G. Huang
Haiti: Earthquake damage map - January 12, 2009 Credit OCHA Page created by W. G. Huang
Haiti Earthquakes Potentially Affected Population Credit OCHA Page created by W. G. Huang
Fast teleseismic body-wave source inversion (by Martin Vallé; Géoazur, Nice, France)
Source parameters, uncertainties and agreement with teleseismic data. (Top left) Optimal values of moment magnitude, depth and focal mechanism. (Bottom left) Uncertainty analysis : misfit and moment magnitude changes as a function of dip and depth variations around their optimal values. Optimal dip and depth are indicated by the white diamond (the best misfit value is also shown). The thick line is the iso-misfit contour (noted C1) joining points with misfit 10% larger than the best value. The four thin lines are the iso-misfit contours joining points with misfit 25%, 50%, 75% and 100% larger than the best value. Moment magnitude associated with each (dip-depth) couple is shown with the colorscale. Acceptable values of dip, depth and magnitude are those which are inside the C1 contour. (Right) Agreement between data (black) and synthetics (red), both for compressive (i.e. P, PcP, PP) waves and transverse (i.e. S, ScS) waves (frequency band : 0.005-0.03Hz). Name of the station, azimuth, distance and maximum amplitude (in microns) are shown for each signal.
Broadband Source time functions (RSTFs), in the time and frequency domains. (Top left) Optimal values of moment magnitude, depth and focal mechanism. (Bottom left) Spectrum of the compressive RSTFs. The classical omega-2 slope is shown in the left part of the figure. (Right) Broadband RSTFs, in the time domain, for compressive waves. For each RSTF, the name of the station, its azimuth and epicentral distance are shown.
Finite Fault Model Preliminary Result of the Jan 12, 2010 Mw 7.0 Haiti Earthquake Gavin Hayes, NEIC
Cross-section of slip distribution. The strike direction of fault plane is indicated by the black arrow and the hypocenter location is denoted by the red star. The slip amplitude are showed in color and motion direction of the hanging wall relative to the footwall is indicated by white arrows. Contours show the rupture initiation time in seconds.
Source time function, describing the rate of moment release with time after earthquake origin.
Comparison of teleseismic body waves. The data is shown in black and the synthetic seismograms are plotted in red. Both data and synthetic seismograms are aligned on the P or SH arrivals. The number at the end of each trace is the peak amplitude of the observation in micro-meter. The number above the beginning of each trace is the source azimuth and below is the epicentral distance. Shading describes relative weighting of the waveforms.
Comparison of long period surface waves. The data is shown in black and the synthetic seismograms are plotted in red. Both data and synthetic seismograms are aligned on the P or SH arrivals. The number at the end of each trace is the peak amplitude of the observation in micro-meter. The number above the beginning of each trace is the source azimuth and below is the epicentral distance. Shading describes relative weighting of the waveforms.
Surface projection of the slip distribution superimposed on ETOPO2. The dark gray circles indicate the locations of ~20 hours of aftershocks.
Before and after satellite imagery of an area of Port-au-Prince After Before Credit Digital Globe Page created by W. G. Huang
Credit Digital Globe Page created by W. G. Huang
Credit Digital Globe Page created by W. G. Huang
Credit Digital Globe Page created by W. G. Huang
Credit Digital Globe Page created by W. G. Huang
Credit Digital Globe Page created by W. G. Huang
Credit Digital Globe Page created by W. G. Huang
Credit Digital Globe Page created by W. G. Huang