5 th Ecosystem Services Partnership Conference
10 likes | 155 Views
5 th Ecosystem Services Partnership Conference. SPATIAL CONGRUENCE BETWEEN BIODIVERSITY AND ECOSYSTEM SERVICES IN THE BASQUE COUNTRY REGION (N OF SPAIN). Lorena Peña*, Beatriz Fernández, Gloria Rodríguez, Ibone Amezaga, Miren Onaindia

5 th Ecosystem Services Partnership Conference
E N D
Presentation Transcript
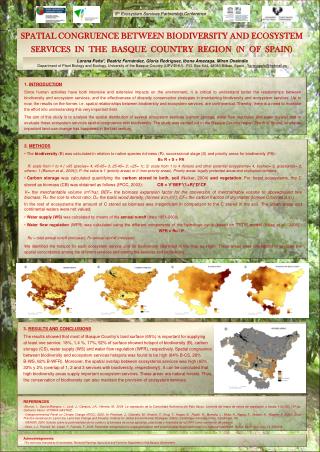
5thEcosystemServicesPartnershipConference SPATIAL CONGRUENCE BETWEEN BIODIVERSITY AND ECOSYSTEM SERVICES IN THE BASQUE COUNTRY REGION (N OF SPAIN) Lorena Peña*, Beatriz Fernández, Gloria Rodríguez, Ibone Amezaga, Miren Onaindia Department of Plant Biology and Ecology, University of the Basque Country (UPV/EHU). P.O. Box 644, 48080 Bilbao, Spain . *lorenapelo@hotmail.es 1. INTRODUCTION Since human activities have both intensive and extensive impacts on the environment, it is critical to understand better the relationships between biodiversity and ecosystem services, and the effectiveness of diversity conservation strategies in maintaining biodiversity and ecosystem services. Up to now, the results on the former, i.e. spatial relationships between biodiversity and ecosystem services, are controversial. Thereby, there is a need to increase the effort into understanding this very important field. The aim of this study is to analyse the spatial distribution of several ecosystem services (carbon storage, water flow regulation and water supply) and to evaluate these ecosystem services spatial congruence with biodiversity. The study was carried out in the Basque Country region (North of Spain), where an important land-use change has happened in the last century. • 2. METHODS • The biodiversity (B)was calculated in relation to native species richness (R), successional stage (S) and priority areas for biodiversity (PA): B= R + S + PA • R: scale from 1 to 4 ( >65 species= 4; 45-65= 3; 25-45= 2; <25= 1); S: scale from 1 to 4 (forests and other potential ecosystems= 4, bushes= 3, grasslands= 2, others= 1 (Biurrun et al., 2009)); P: the value is 1 (priority areas) or 0 (non priority areas). Priority areas: legally protected areas and ecological corridors. • Carbon storage was calculated quantifying the carbon stored in both, soil (Neiker, 2004) and vegetation. For forest ecosystems, the C stored as biomass (CB) was obtained as follows (IPCC, 2003): CB = V*BEF*(1+R)*D*CF • V= the merchantable volume (m3/ha); BEF= the biomass expansion factor for the conversion of merchantable volume to aboveground tree biomass; R= the root-to-shoot ratio; D= the basic wood density, (tonnesd.m./m3); CF= the carbon fraction of dry matter (tonnes C/tonnesd.m.) • In the rest of ecosystems the amount of C stored as biomass was insignificant in comparison to the C stored in the soil. The urban areas and continental waters were not valued. • Water supply (WS) was calculated by means of the annual runoff (data 1951-2000). • Water flow regulation (WFR) was calculated using the different components of the hydrologic cycle (based on TETIS model (Vélez et al., 2009)): WFR = Ru / P • Ru = total annualrunoff (mm/year); P= annualrainfall (mm/year) • We identified the hotspot for each ecosystem service and for biodiversity (identified in the map as High). These areas were overlapped to evaluate the spatial concordance among the different services and among the services and biodiversity. 3. RESULTS AND CONCLUSIONS The results showed that most of Basque Country’s land surface (65%) is important for supplying at least one service. 18%, 1,4 %, 17%, 52% of surface showed hotspot of biodiversity (B), carbon storage (CS), water supply (WS) and water flow regulation (WFR), respectively. Spatial congruence between biodiversity and ecosystem services hotspots was found to be high (84% B-CS, 28% B-WS, 62% B-WFR). Moreover, the spatial overlap between ecosystems services was high (65%, 33% y 2% (overlap of 1, 2 and 3 services with biodiversity, respectively)). It can be concluded that high biodiversity areas supply important ecosystem services. These areas are natural forests. Thus, the conservation of biodiversity can also maintain the provision of ecosystem services. • REFERENCES • Biurrun, I., García-Mijangos, I., Loidi, J., Campos, J.A., Herrera, M., 2009. La vegetación de la Comunidad Autónoma del País Vasco. Leyenda del mapa de series de vegetación a escala 1:50.000. 197 pp. Gobierno Vasco, VITORIA-GASTEIZ. • Intergovernmental Panel onClimateChange (IPCC), 2003. In: Penmam, J., Gytarsky, M., Hiraishi, T., Krug, T., Kruger, D., Pipatti, R., Buendia, L., Miwa, K., Ngara, T., Tanabe, K., Wagner, F. (Eds.), GoodPracticeGuidanceforLand Use, Land-Use Change and Forestry. Institutefor Global EnvironmentalStrategies (IGES), Cambridge UniversityPress, Cambridge, UK. • NEIKER, 2004. Estudio sobre la potencialidad de los suelos y la biomasa de zonas agrícolas, pascícolas y forestales de la CAPV como sumideros de carbono. • Vélez, J.J., Puricelli, M., López, F., Francés, F., 2009. Parameterextrapolationtoungaugedbasinswith a hydrologicaldistributedmodel in a regional framework. Hydrol. EarthSyst. Sci., 13, 229-246. Acknowledgements This work was financed by Enviromental, Territorial Planning, Agriculture and Fisheries Department of theBasqueGovernment.