Download
1 / 48
560 likes | 688 Views
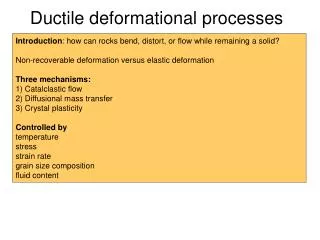
Explore the principles of dislocations in metals and ceramics, focusing on their motion and effects on material strength. Learn about plastic deformation, slip systems, and strategies for strengthening metals through grain size reduction and solid solutions. The chapter addresses critical questions such as the relationship between dislocation motion and material strength, the impact of heating on material properties, and the differences in deformation mechanisms across various material classes.

E N D
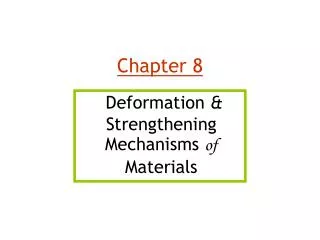
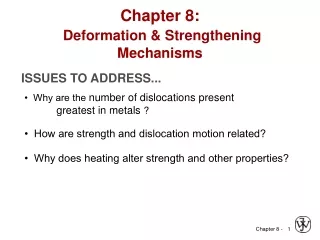
Chapter 8: Deformation & Strengthening Mechanisms ISSUES TO ADDRESS... • Why are the number of dislocations present greatest in metals ? • How are strength and dislocation motion related? • Why does heating alter strength and other properties?
Dislocations & Materials Classes • Metals (Cu, Al): Dislocation motion easiest - non-directional bonding - close-packed directions for slip + + + + + + + + + + + + + + + + + + + + + + + + ion cores electron cloud • Covalent Ceramics (Si, diamond): Motion difficult - directional (angular) bonding • Ionic Ceramics (NaCl): Motion difficult - need to avoid nearest neighbors of like sign (- and +) - - - + + + + - - - - + + + - - - + + + +
Dislocation Motion Dislocation motion & plastic deformation • Metals - plastic deformation occurs by slip – an edge dislocation (extra half-plane of atoms) slides over adjacent plane half-planes of atoms. Adapted from Fig. 8.1, Callister & Rethwisch 3e. • If dislocations can't move, plastic deformation doesn't occur!
Dislocation Motion • A dislocation moves along a slip plane in a slip direction perpendicular to the dislocation line • The slip direction is the same as the Burgers vector direction Edge dislocation Adapted from Fig. 8.2, Callister & Rethwisch 3e. Screw dislocation
Adapted from Fig. 8.6, Callister & Rethwisch 3e. • FCC Slip occurs on {111} planes (close-packed) in <110> directions (close-packed) • => total of 12 slip systems in FCC Deformation Mechanisms Slip System • Slip plane - plane on which easiest slippage occurs • Highest planar densities (and large interplanar spacings) • Slip directions- directions of movement • Highest linear densities • For BCC & HCP there are other slip systems.
Applied tensile Relation between Resolved shear s s tR stress: = F/A and tR stress: = F /A s s F tR slip plane normal, ns FS /AS = A l f F cos A / cos tR f nS F AS slip direction l A FS FS AS slip direction F slip direction tR Stress and Dislocation Motion • • Resolved shearstress, tR • results from applied tensile stresses
Critical Resolved Shear Stress typically 10-4GPa to 10-2 GPa s s s tR s = 0 tR /2 = 0 tR = f l =90° l =90° =45° f =45° • Condition for dislocation motion: • Ease of dislocation motion depends on crystallographic orientation maximum at = = 45º
Single Crystal Slip Adapted from Fig. 8.9, Callister & Rethwisch 3e. Adapted from Fig. 8.8, Callister & Rethwisch 3e.
Ex: Deformation of single crystal a) Will the single crystal yield? b) If not, what stress is needed? So the applied stress of 6500 psi will not cause the crystal to yield. = 60° crss = 20.7 MPa = 35° Adapted from Fig. 8.7, Callister & Rethwisch 3e. = 6500 psi
So for deformation to occur the applied stress must be greater than or equal to the yield stress Ex: Deformation of single crystal What stress is necessary (i.e., what is the yield stress, sy)?
Slip Motion in Polycrystals s 300 mm • Stronger - grain boundaries pin deformations • Slip planes & directions (l, f) change from one crystal to another. • tRwill vary from one crystal to another. • The crystal with the largest tR yields first. • Other (less favorably oriented) crystals yield later. Adapted from Fig. 8.10, Callister & Rethwisch 3e. (Fig. 8.10 is courtesy of C. Brady, National Bureau of Standards [now the National Institute of Standards and Technology, Gaithersburg, MD].)
Anisotropy in sy - after rolling rolling direction - anisotropic since rolling affects grain orientation and shape. • Can be induced by rolling a polycrystalline metal - before rolling Adapted from Fig. 8.11, Callister & Rethwisch 3e. (Fig. 8.11 is from W.G. Moffatt, G.W. Pearsall, and J. Wulff, The Structure and Properties of Materials, Vol. I, Structure, p. 140, John Wiley and Sons, New York, 1964.) 235 mm - isotropic since grains are approx. spherical & randomly oriented.
Anisotropy in Deformation 1. Cylinder of tantalum machined from a rolled plate: 2. Fire cylinder at a target. 3. Deformed cylinder Photos courtesy of G.T. Gray III, Los Alamos National Labs. Used with permission. rolling direction plate thickness direction end view • The noncircular end view shows anisotropic deformation of rolled material. side view
4 Strategies for Strengthening Metals: 1: Reduce Grain Size • Grain boundaries are barriers to slip. • Barrier "strength" increases with Increasing angle of misorientation. • Smaller grain size: more barriers to slip. • Hall-Petch Equation: Adapted from Fig. 8.14, Callister & Rethwisch 3e. (Fig. 8.14 is from A Textbook of Materials Technology, by Van Vlack, Pearson Education, Inc., Upper Saddle River, NJ.)
4 Strategies for Strengthening Metals: 2: Solid Solutions • Smaller substitutional impurity • Larger substitutional impurity A C D B Impurity generates local stress at A and B that opposes dislocation motion to the right. Impurity generates local stress at C and D that opposes dislocation motion to the right. • Impurity atoms distort the lattice & generate stress. • Stress can produce a barrier to dislocation motion.
Stress Concentration at Dislocations Adapted from Fig. 8.4, Callister & Rethwisch 3e.
Strengthening by Alloying • small impurities tend to concentrate at dislocations • reduce mobility of dislocation increase strength Adapted from Fig. 8.17, Callister & Rethwisch 3e.
Strengthening by Alloying • large impurities concentrate at dislocations on low density side Adapted from Fig. 8.18, Callister & Rethwisch 3e.
180 400 120 Yield strength (MPa) Tensile strength (MPa) 300 60 200 0 10 20 30 40 50 0 10 20 30 40 50 wt.% Ni, (Concentration C) wt.%Ni, (Concentration C) Ex: Solid SolutionStrengthening in Copper • Tensile strength & yield strength increase with wt% Ni. Adapted from Fig. 8.16 (a) and (b), Callister & Rethwisch 3e. • Empirical relation: • Alloying increases sy and TS.
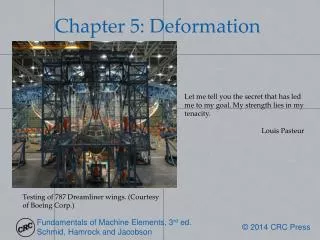
4 Strategies for Strengthening Metals: 3: Precipitation Strengthening precipitate Side View Unslipped part of slip plane Top View S spacing Slipped part of slip plane • Hard precipitates are difficult to shear. Ex: Ceramics in metals (SiC in Iron or Aluminum). Large shear stress needed to move dislocation toward precipitate and shear it. Dislocation “advances” but precipitates act as “pinning” sites with spacing S . • Result:
Application:Precipitation Strengthening 1.5mm • Internal wing structure on Boeing 767 Adapted from chapter-opening photograph, Chapter 11, Callister & Rethwisch 3e. (courtesy of G.H. Narayanan and A.G. Miller, Boeing Commercial Airplane Company.) • Aluminum is strengthened with precipitates formed by alloying. Adapted from chapter-opening photograph, Chapter 11, Callister & Rethwisch 3e. (courtesy of G.H. Narayanan and A.G. Miller, Boeing Commercial Airplane Company.)
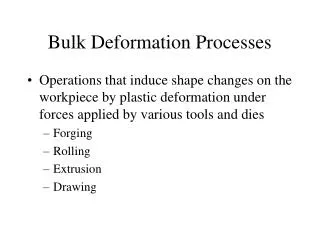
force -Forging -Rolling roll die A d A A A o blank o d Adapted from Fig. 14.2, Callister & Rethwisch 3e. roll force -Drawing -Extrusion A o die container A d die holder tensile force A o ram A billet extrusion d force die die container 4 Strategies for Strengthening Metals: 4: Cold Work (%CW) • Room temperature deformation. • Common forming operations change the cross sectional area:
Dislocations During Cold Work 0.9 mm • Ti alloy after cold working: • Dislocations entangle with one another during cold work. • Dislocation motion becomes more difficult. Adapted from Fig. 5.11, Callister & Rethwisch 3e. (Fig. 5.11 is courtesy of M.R. Plichta, Michigan Technological University.)
total dislocation length unit volume s large hardening s y1 s small hardening y0 e Result of Cold Work Dislocation density = • Carefully grown single crystal ca. 103 mm-2 • Deforming sample increases density 109-1010 mm-2 • Heat treatment reduces density 105-106 mm-2 • Yield stress increases as rd increases:
Effects of Stress at Dislocations Adapted from Fig. 8.5, Callister & Rethwisch 3e.
Impact of Cold Work As cold work is increased • Yield strength (sy) increases. • Tensile strength (TS) increases. • Ductility (%EL or %AR) decreases. Adapted from Fig. 8.20, Callister & Rethwisch 3e.
Cold Work Analysis Copper Cold Work D =15.2mm D =12.2mm o d tensile strength (MPa) yield strength (MPa) ductility (%EL) 60 800 700 40 600 500 Cu 300MPa 300 Cu 20 400 340MPa Cu 7% 100 200 0 0 20 40 60 0 20 40 60 0 20 40 60 % Cold Work % Cold Work % Cold Work s = 300MPa TS = 340MPa %EL = 7% y • What is the tensile strength & ductility after cold working? Adapted from Fig. 8.19, Callister & Rethwisch 3e. (Fig. 8.19 is adapted from Metals Handbook: Properties and Selection: Iron and Steels, Vol. 1, 9th ed., B. Bardes (Ed.), American Society for Metals, 1978, p. 226; and Metals Handbook: Properties and Selection: Nonferrous Alloys and Pure Metals, Vol. 2, 9th ed., H. Baker (Managing Ed.), American Society for Metals, 1979, p. 276 and 327.)
s-e Behavior vs. Temperature 800 -200C 600 -100C Stress (MPa) 400 25C 200 0 0 0.1 0.2 0.3 0.4 0.5 Strain 3 . disl. glides past obstacle 2. vacancies replace atoms on the obstacle disl. half 1. disl. trapped plane by obstacle • Results for polycrystalline iron: Adapted from Fig. 7.14, Callister & Rethwisch 3e. • sy and TS decrease with increasing test temperature. • %ELincreases with increasing test temperature. • Why? Vacancies help dislocations move past obstacles.
Effect of Heating After %CW annealing temperature (ºC) 100 200 300 400 500 600 700 600 60 tensile strength 50 500 ductility (%EL) 40 tensile strength (MPa) 400 30 ductility 20 300 Recovery Grain Growth Recrystallization • 1 hour treatment at Tanneal... decreases TS and increases %EL. • Effects of cold work are reversed! • 3 Annealing stages to discuss... Adapted from Fig. 8.22, Callister & Rethwisch 3e. (Fig. 8.22 is adapted from G. Sachs and K.R. van Horn, Practical Metallurgy, Applied Metallurgy, and the Industrial Processing of Ferrous and Nonferrous Metals and Alloys, American Society for Metals, 1940, p. 139.)
Recovery • Scenario 1 extra half-plane of atoms Dislocations Results from diffusion annihilate atoms and form diffuse a perfect to regions atomic of tension plane. extra half-plane of atoms tR 3 . “Climbed” disl. can now move on new slip plane 2 . grey atoms leave by 4. opposite dislocations vacancy diffusion meet and annihilate allowing disl. to “climb” Obstacle dislocation 1. dislocation blocked; can’t move to the right Annihilation reduces dislocation density. • Scenario 2
Recrystallization 0.6 mm 0.6 mm 33% cold worked brass New crystals nucleate after 3 sec. at 580C. • New grains are formed that: -- have a small dislocation density -- are small -- consume cold-worked grains. Adapted from Fig. 8.21 (a),(b), Callister & Rethwisch 3e. (Fig. 8.21 (a),(b) are courtesy of J.E. Burke, General Electric Company.)
Further Recrystallization 0.6 mm 0.6 mm After 8 seconds After 4 seconds • All cold-worked grains are consumed. Adapted from Fig. 8.21 (c),(d), Callister & Rethwisch 3e. (Fig. 8.21 (c),(d) are courtesy of J.E. Burke, General Electric Company.)
Grain Growth 0.6 mm 0.6 mm After 8 s, 580ºC After 15 min, 580ºC coefficient dependent on material and T. • Empirical Relation: exponent typ. ~ 2 elapsed time grain diam. at time t. Ostwald Ripening • At longer times, larger grains consume smaller ones. • Why? Grain boundary area (and therefore energy) is reduced. Adapted from Fig. 8.21 (d),(e), Callister & Rethwisch 3e. (Fig. 8.21 (d),(e) are courtesy of J.E. Burke, General Electric Company.)
TR º TR = recrystallization temperature Adapted from Fig. 8.22, Callister & Rethwisch 3e. º
Recrystallization Temperature, TR TR= recrystallization temperature = point of highest rate of property change • Tm => TR 0.3-0.6 Tm (K) • Due to diffusion annealing time TR = f(time) shorter annealing time => higher TR • Higher %CW => lower TR– strain hardening • Pure metals lower TR due to dislocation movements • Easier to move in pure metals => lower TR
Coldwork Calculations A cylindrical rod of brass originally 0.40 in (10.2 mm) in diameter is to be cold worked by drawing. The circular cross section will be maintained during deformation. A cold-worked tensile strength in excess of 55,000 psi (380 MPa) and a ductility of at least 15 %EL are desired. Further more, the final diameter must be 0.30 in (7.6 mm). Explain how this may be accomplished.
D = 0.40 in o Brass Cold Work D = 0.30 in f Coldwork Calculations Solution If we directly draw to the final diameter what happens?
420 540 6 Coldwork Calc Solution: Cont. • For %CW = 43.8% Adapted from Fig. 8.19, Callister & Rethwisch 3e. • y = 420 MPa • TS = 540 MPa > 380 MPa • %EL = 6 < 15 • This doesn’t satisfy criteria…… what can we do?
15 380 27 12 > 12 %CW < 27 %CW Coldwork Calc Solution: Cont. Adapted from Fig. 8.19, Callister & Rethwisch 3e. ForTS > 380 MPa For%EL > 15 our working range is limited to %CW = 12-27
Intermediate diameter = Coldwork Calc Soln: Recrystallization Cold draw-anneal-cold draw again • For objective we need a cold work of %CW 12-27 • We’ll use %CW = 20 • Diameter after first cold draw (before 2nd cold draw)? • must be calculated as follows:
Coldwork Calculations Solution Summary: • Cold work D01= 0.40 in Df1 = 0.335 m • Anneal above D02 = Df1 • Cold work D02= 0.335 in Df2 =0.30 m Therefore, meets all requirements Fig 7.19
50% start finish log t Rate of Recrystallization • Hot work above TR • Cold work below TR • Smaller grains • stronger at low temperature • weaker at high temperature
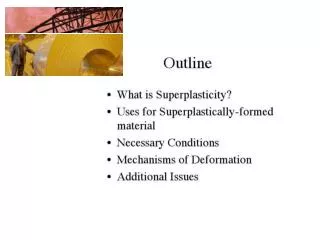
Mechanical Properties of Polymers – Stress-Strain Behavior brittle polymer plastic elastomer elastic moduli – less than for metals Adapted from Fig. 7.22, Callister & Rethwisch 3e. • Fracture strengths of polymers ~ 10% of those for metals • Deformation strains for polymers > 1000% –for most metals, deformation strains < 10% 43
Mechanisms of Deformation—Brittle Crosslinked and Network Polymers NearFailure Near Failure Initial network polymer s (MPa) brittle failure Initial x plastic failure x e aligned, crosslinked polymer Stress-strain curves adapted from Fig. 7.22, Callister & Rethwisch 3e. 44
Mechanisms of Deformation — Semicrystalline (Plastic) Polymers fibrillar structure near failure crystalline block segments amorphous separate crystalline regions undeformed regions align elongate structure s (MPa) brittle failure x Stress-strain curves adapted from Fig. 7.22, Callister & Rethwisch 3e. Inset figures along plastic response curve adapted from Figs. 8.27 & 8.28, Callister & Rethwisch 3e. (Figs. 8.27 & 8.28 are from J.M. Schultz, Polymer Materials Science, Prentice-Hall, Inc., 1974, pp. 500-501.) onset of necking plastic failure x unload/reload e 45
Predeformation by Drawing • Drawing…(ex: monofilament fishline) -- stretches the polymer prior to use -- aligns chains in the stretching direction • Results of drawing: -- increases the elastic modulus (E) in the stretching direction -- increases the tensile strength (TS) in the stretching direction -- decreases ductility (%EL) • Annealing after drawing... -- decreases chain alignment -- reverses effects of drawing (reduces E and TS, enhances %EL) • Contrast to effects of cold working in metals! Adapted from Fig. 8.28, Callister & Rethwisch 3e. (Fig. 8.28 is from J.M. Schultz, Polymer Materials Science, Prentice-Hall, Inc., 1974, pp. 500-501.) 46
Mechanisms of Deformation—Elastomers final: chains are straighter, still cross-linked deformation initial: amorphous chains are is reversible (elastic)! kinked, cross-linked. s (MPa) brittle failure x Stress-strain curves adapted from Fig. 7.22, Callister & Rethwisch 3e. Inset figures along elastomer curve (green) adapted from Fig. 8.30, Callister & Rethwisch 3e. (Fig. 8.30 is from Z.D. Jastrzebski, The Nature and Properties of Engineering Materials, 3rd ed., John Wiley and Sons, 1987.) plastic failure x x elastomer e • Compare elastic behavior of elastomers with the: -- brittle behavior (of aligned, crosslinked & network polymers), and -- plastic behavior (of semicrystalline polymers) (as shown on previous slides) 47
Summary • Dislocations are observed primarily in metals and alloys. • Strength is increased by making dislocation motion difficult. • Particular ways to increase strength are to: -- decrease grain size -- solid solution strengthening -- precipitate strengthening -- cold work • Heating (annealing) can reduce dislocation density and increase grain size. This decreases the strength.