Download
1 / 24
240 likes | 461 Views
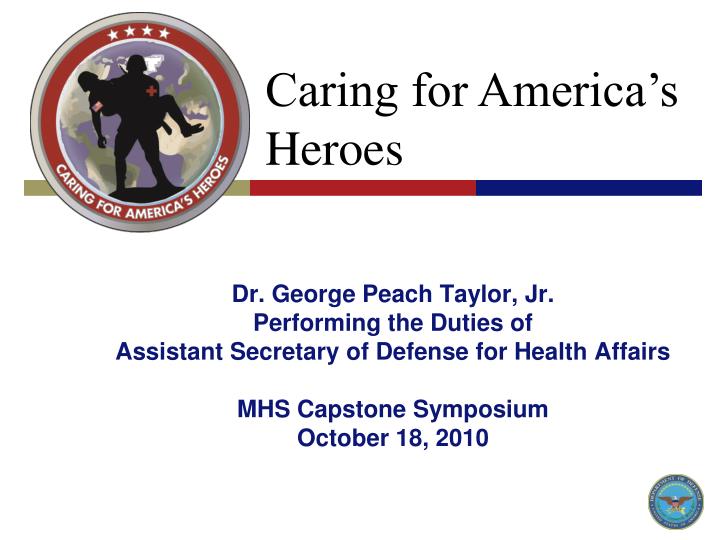
Dr. George Peach Taylor, Jr. Performing the Duties of Assistant Secretary of Defense for Health Affairs MHS Capstone Symposium October 18, 2010. The Quadruple Aim. READINESS. POPULATION HEALTH. Enabling a medically ready force, a ready medical force, and resiliency of all MHS personnel.

E N D
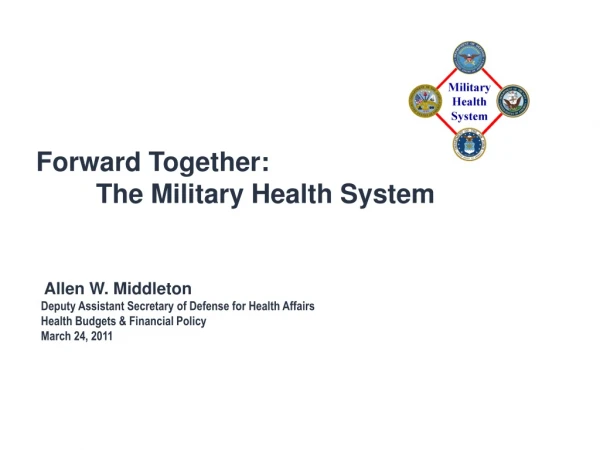
Dr. George Peach Taylor, Jr. Performing the Duties of Assistant Secretary of Defense for Health Affairs MHS Capstone Symposium October 18, 2010
The Quadruple Aim READINESS POPULATION HEALTH Enabling a medically ready force, a ready medical force, and resiliency of all MHS personnel. Improving quality and health outcomes for a defined populations. Advocating and incentivizing healthy behaviors. EXPERIENCE OF CARE PER CAPITA COST Patient- and family-centered care that is seamless and integrated. Providing patients the care they need, exactly when and where they need it. Managing the cost of providing care. Eliminate waste and reduce unwarranted variation; reward outcomes, not outputs. 2
ASD-HA Priorities • Wounded Warrior Care • Patient Centered Medical Home • Electronic Health Record • BRAC • TRICARE Contracts • Cost Containment
MHS Strategic Imperatives Scorecard Design Phase Approved Funded Current Performance Known and FY10 Target Approved Out-Year Targets Approved Measure Algorithm Developed Concept Only 4 *Denotes change in measure algorithm
Fully Ready Partially Ready Not Ready Indeterminant Y Individual Medical Readiness We have noted steady improvement over the last year two fiscal years, and currently 6% below the 2010 target. Our greatest opportunity for improvement is the Reserve Component. 2010 Target About the Measure • Status Thresholds: • Green: ≥ 80% • Yellow: 71% ~ 79% • Red: < 70% • Targets*: • 2011: 81% • 2012: 82% • 2014: 85% • *Fully + Partially Ready Executive Sponsor: FHPC Working Group: IMR Working Group Measure Advocate: Col José Rodriguez-Vazquez, T MA-FHP&RP; (703) 578-8572 Monitoring: Quarterly Data Source: Service Data Repositories Other Reporting: Service Assistant Secretaries (M&RA); Status of the Forces What are we measuring? This measure is the best-available indicator of the medical readiness of the total force based on requirements in DoDI 6025.19 and as reported by the Services via the DoD IMR Working Group. The elements of IMR are: (1) dental readiness, (2) immunization status, (3) individual medical equipment, (4) medical readiness laboratory studies, (5) no deployment limiting medical condition and (6) periodic health assessment (PHA). The Directive sets a goal of 75% fully medically ready; the IMR working group has set a target of 80% total force medically ready (i.e., fully + partially ready). Why is it important? This measure provides operational commanders, Military Department leaders, and primary care managers the ability to monitor the medical readiness status of their personnel, ensuring a healthy and fit fighting force medically ready to deploy. What does our performance tell us? The Total Force medical readiness has shown slow by steady improvement for the last two fiscal years, with the Active Component being higher than the Reserve Component. Drivers for improvement include reduction in: (1) delinquent PHAs, (2) deployment-limiting medical conditions (e.g., asthma, pregnancy, severe injury with incomplete rehabilitation), (3) delinquent dental exams (Dental Class 4), and non-deployable dental conditions (Dental Class 3). 5
Y Percent of Visits Where MTF Enrollees See Their PCM Processes at several of our top performing MTFs should be captured and disseminated to assist other MTFs. 2011 Target = 60% 46% 42% 40% 39% About the Measure • Status Thresholds: • Green: > 60% • Yellow: 40% -59% • Red: < 39% • Targets: • 2011: 60% • 2012: 65% • 2014: 70% Executive Sponsor: JHOC Working Group: None Measure Advocate: TBD Monitoring: TBD Data Source: CHCS Other Reporting: None What are we measuring? We are measuring the percentage of visits that MTF prime enrollees see their primary care manager (PCM). Numerator is # of appointments where patients saw their assigned PCM and denominator is Total number of appointments. Note: This measure no longer filters out visits where the patient’s PCM is not in clinic. Why is it important? This is important because we believe PCM continuity improves patient-provider communication and trust, which leads to more activated patients and a positive impact on every aspect of the quadruple aim. What does our performance tell us? In FY10, we have realized gradual improvement, with a number of MTFs meeting the 2010 target. Performance appears to have flattened during the 3rd quarter and the current trajectory would indicated we will not meet our goal of 60%. We may be able to influence the rate of improvement by learning from top performers. 6
G Percent of Beneficiaries Satisfied With Health Care Satisfaction has increased and we were able to achieve our FY10 target. Satisfaction in the private sector is consistently higher than that in the direct care system. About the Measure • Status Thresholds: • Green: > 60% • Yellow: 46% - 59% • Red: < 45% • Targets: • 2011: 61% • 2012: 62% • 2014: 64% Executive Sponsor: JHOC Working Group: Tri-Svc Survey WG Measure Advocate: Dr. Rich Bannick, TMA-HPA&E; (703) 681-3636 Monitoring: Quarterly Data Source: Health Care Survey of DoD Beneficiaries Other Reporting: Status of Forces What are we measuring? We are measuring beneficiary satisfaction with overall health care using the Consumer Assessment of Healthcare Providers and Systems (CAHPS) Health Plan Survey 4.0. Beneficiaries are asked: Using any number from 1 to 10, where 0 is the worst health care possible and 10 is the best health care possible, what number would you use to rate all your health care in the last 12 months? Responses of 8, 9, or 10 indicate patient satisfaction. The benchmark comes from CAHPS average of 250 health plans. Why is it important? More satisfied beneficiaries are more likely to follow our advice regarding health choices and are more likely to come to our providers for health services. What does our performance tell us? Although statistically insignificant, the overall trend in recent quarters has been positive, and as a system we reached our 2010 goal in 3rd quarter, FY10. It should be noted that achieving the year 10 goal was predominantly due to beneficiary satisfaction in the private sector as each of the Services remain below the 2010 target. 7
“No Higher Priority” “They deserve the very best facilities and care to recuperate from their injuries and ample assistance to navigate the next step in their lives, and that is what we intend to give them. Apart from the war itself, this department and I have no higher priority.” Robert Gates Secretary of Defense
Medical R&D Major Program Areas FY 2010 Appropriation (Includes Congressional Marks) Military Operational Medicine Mild Traumatic Brain Injury Injury Prevention & Reduction Psychological Health & Resilience Physiological Health Environmental Health & Protection Clinical and Rehabilitation Medicine Regenerative Medicine Neuromusculoskeletal Injury Acute/Chronic Pain Mgmt Sensory System Injury Cancer Muscular Dystrophy Multiple Sclerosis Autisim Diabetes $350M Radiation Health Effects Health IT, Medical Training and Simulation Diagnostic Biodosimetry Countermeasures - Protection - Treatment EHR Applications Med-Surgical Simulation Technologies Skills Retention/Transference Re-entry $500M $10M Combat Casualty Care Infectious Diseases $175M Wound Infection - Prevention - Management - Treatment Pathogen Detection HIV Prevention H1N1 Diagnostics Damage Control Resuscitation Penetrating Traumatic Brain Injury Combat Trauma Therapies Health Monitoring & Diagnostic Technology $50M $200M Actual values subject to scientific/program review of proposals, awards & research support costs 10
Cost Containment “I think we need to lay out for Congress how health care is eating the department alive… In the fiscal 2010 request, health care costs $47 billion…. “We will spend on health care what the entire foreign affairs budget is….” – Secretary Robert Gates April 7, 2009
Cost Containment What is Driving DoD Health Care Costs?
FY 2010 DoD Health Care Costs $49,818M 80% of total cost driven by either contributions to MERCHF or O&M O&M ($28,857M) 78% of O&M driven by patient care
Growth in the Unified Medical Budget(Excluding GWOT) Increase over FY2000 $46.7B 268% $12.1B –26% $2.5B – 5% $5.2B – 11% ($M) $9.0B – 19% $18.0B – 39% FY2000 Baseline $17.4B Volume/Intensity/CostShare Creep, etc is the residual after all explicit causes have been removed New users accounts for increase in percentage of eligible beneficiaries under 65 who rely on TRICARE (See Slide 11 for trend) Explicit Benefit Changes <65 are estimates base on legislative changes to the benefit (See Slide 8 for examples) Explicit Beenfit Changes to 65+ is the Normal cost to the department minus the Level of Effort for MTF Care prior to the MERCHF
Proportion of Retirees <65 Using TRICARE Is Increasing Number of eligibles is a count from DEERS of Retirees, Retiree Family Members or Survivors at the end of the year. Projected number of eligibles is based on MCFAS. User defined as an eligible beneficiary using either an MTF or Private Sector Care for at least one visit during the year. Projected number of users is an extrapolation of current trends.
Total Enrollees (TRICARE Prime) TRICARE Prime enrollees on average are costlier than Standard/Extra users.
Healthcare Utilization Trends Percent Increase Cumulative Avg increase per year avg = 5.4% Avg increase per year avg = 2.3% Avg increase per year avg = 0.6% Outpatient visits – displayed data incorporates a standardized weighted visit that is adjusted for varying degrees of healthcare complexity Prescriptions – uses an adjusted 30 day prescription to normalize military treatment facility, retail pharmacy, and mail order pharmacy Inpatient stays – displayed data incorporates a standardized weighted stay that is adjusted for varying degrees of healthcare complexity includes inpatient acute care hospital encounters but excludes residential inpatient treatment, counted as bed days Trend applies to beneficiaries enrolled in TRICARE Prime 18
Medical Cost Per Equivalent Life 19 Prior Qtr Current Qtr Definition, Target, Parameters Data Source: M2 (SIDR/SADR/HCSR-I/HCSR-NI,PDTS); EASIV; Enrollees are adjusted for Age/Gender/Bencat Current as of Jul 10, with measure reported through Dec 09. (Portions of value are projected due to missing expense data from MTFs.) Average Annual % Increase: Army: 11.9% Navy: 10.6% AF: 8.0% MCSC: 6.0%
Dr. George Peach Taylor, Jr. Performing the Duties of Assistant Secretary of Defense for Health Affairs MHS Capstone Symposium October 18, 2010
The Quadruple Aim Enabling a medically ready force, a ready medical force, and resiliency of all MHS personnel. Experience of Care Population Health Improving quality and health outcomes for a defined population. Advocating and incentivizing healthy behaviors. Readiness Patient and family centered care that is seamless and integrated. Providing patients the care they need, exactly when and where they need it. Per Capita Cost Managing the cost of providing care for the population. Eliminate waste and reduce unwarranted variation; reward outcomes, not outputs. 23 23
The Quadruple Aim Readiness Ensuring that the total military force is medically ready to deploy and that the medical force is ready to deliver health care anytime, anywhere in support of the full range of military operations, including humanitarian missions. Population Health Reducing the generators of ill health by encouraging healthy behaviors and decreasing the likelihood of illness through focused prevention and the development of increased resilience. Experience of Care Providing a care experience that is patient and family centered, compassionate, convenient, equitable, safe and always of the highest quality. Per Capita Cost Creating value by focusing on quality, eliminating waste, and reducing unwarranted variation; considering the total cost of care over time, not just the cost of an individual health care activity. 24