Download
1 / 8
80 likes | 152 Views
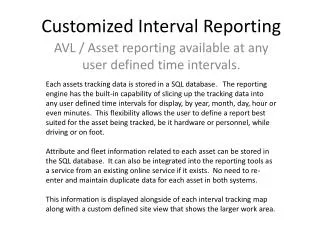
Track assets with customizable interval reporting stored in SQL database. Generate reports by user-defined time intervals. Fleet grouping tools for managing assets. Export data as services for integration.

E N D
Customized Interval Reporting Each assets tracking data is stored in a SQL database. The reporting engine has the built-in capability of slicing up the tracking data into any user defined time intervals for display, by year, month, day, hour or even minutes. This flexibility allows the user to define a report best suited for the asset being tracked, be it hardware or personnel, while driving or on foot. Attribute and fleet information related to each asset can be stored in the SQL database. It can also be integrated into the reporting tools as a service from an existing online service if it exists. No need to re-enter and maintain duplicate data for each asset in both systems. This information is displayed alongside of each interval tracking map along with a custom defined site view that shows the larger work area. AVL / Asset reporting available at any user defined time intervals.
Custom Fleet Grouping tools. Manager, supervisors and responder personnel have the ability to define their personnel fleet view of assets. Larger organizations with many assets and business focuses can define their respective fleets lists for viewing of the live views as well as reporting tools. These views can be shared with others and can display other fleets assets as background items or in the viewer as a separate layer. Assets can be grouped into fleets for display grouping in both the Live views as well as the Reporting tools..
Quick reporting tools A weekly lookup form tracks which assets have been tracked for each day and includes a link to build each report on the fly from the SQL database. Additional tools are available for generating custom interval reports on the fly. There are options for Fleet, asset, time interval and activity filtering in the lookup toolset. The system comes preconfigured for weekly, daily and hourly interval breakdown reports.
Exporting of data as services Theses API services are standards based and implemented to provide your organization the ability to integrate the AVL tracking information into your existing online systems. The examples here show the tracking information being displayed inside of a online map data lookup tool. This allows the AVL managers as well as their customers the option of displaying their data inside of both online web tools as well as Desktop applications. Because these services are standards based they can be integrated into both Proprietary as well as Free and Open Source Software (FOSS) as needed. Any of the information displayed in the Live Map View or the reports can be configured as an online service API for other online systems to access.