Download
1 / 15
150 likes | 286 Views
A new approach to eliminate the broadband absorption in DOAS spectra. M. Ródenas 1 , E. Soria 2 , J.D. Martín 2 1 Fundación CEAM, EUPHORE Labs, 46980 Paterna, Valencia, Spain 2 Dpto. Ingeniería Electrónica. Univ. de Valencia, Burjassot-Valencia, Spain. Speaker: Mila Ródenas.

E N D
A new approach to eliminate the broadband absorption inDOAS spectra M. Ródenas1, E. Soria2, J.D. Martín21Fundación CEAM, EUPHORE Labs, 46980 Paterna, Valencia, Spain 2Dpto. Ingeniería Electrónica. Univ. de Valencia, Burjassot-Valencia, Spain Speaker: Mila Ródenas
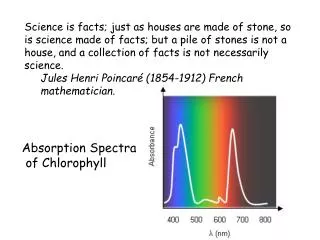
EUPHORE is one of the major research platforms in Europe with outstanding analytical infrastructure to investigate chemical processes related to tropospheric chemistry. Fundación CEAM: EUPHORE • Measurement of contaminants • Provide information for models • Air quality policies improvement • Special focus on the Mediterranean Basin
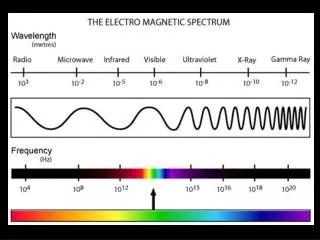
DOAS Setup • White-multireflection cell: 8m base-path (EUPHORE) • Optical Pathlengths: 128-386-640-896-1154m • Resolution: 0.04, 0.08, 0.16 nm/pixel (FWHM=0.18, 0.35, 0.76 nm, resp.) • Several sets of mirrors for detection of different compounds • Range: UV and Visible (200 – 1000 nm) • Automatic adjustment of mirrors in the chamber • Automatic positioning of optical fibers • Spectrometer (Acton-500 Pro) and detector (PDA-3904 Hamamatsu) are thermostated Doas scheme Doas scheme DOAS setup at EUPHORE
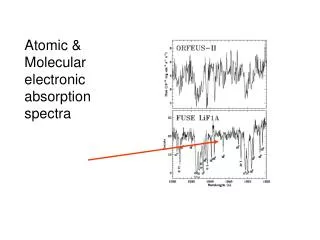
Lambert-Beer Law: Broadband Narrow bands Origin of broadband • Mie scattering (aerosols, particles, λ-1.3) • Raileigh scattering (molecules, λ-4) • Low frequency contribution of the compound of interest • Change of beam position on dielectrical mirrors, etc • Change of lamp spectrum • Compounds with broad structure, etc Broadband structures in DOAS spectra
Choices When to apply it? Binomial smoothing Polynomials Regression Moving average Savitzky-Golay Fourier, etc During the fitting routine Prior to the fitting routine Applied method High-pass filtering Subtraction of low-pass filter FILTERING of broadband structures
Classic DOAS approach Lambert-Beer Law Linear fitting (Pr, aj) Non-linear fitting (dj,k) Drawbacks • ANALYST MUST CHOOSE: • polynomial degree, r • region of analysis • use or not pre-filters? Degrees of freedom No exact rules (Need to check up residuals) ANALYSIS ALGORITHM: Classic Method Dependence with the compounds absorption features Does the broadband match exactly a polynomial? (structures interfering or higher residuals) Reduction of diff. cross section if a pre-filter is used, i.e. INCREASE OF DETECTION LIMIT
Proposed approach Fitting of moving windows of n channels centered in i (Pri, aji) using low r Linear fitting (Pri, aji=aj) Non-linear fitting (dj,k) Advantages • Less intervention of analyst • Low polynomial orders used - width of analysis spectral range • - shape of compounds/broadband • Better match between modelled and real broadband • No need of pre-filter, i.e. NODECREASE OF DETECTION LIMIT ANALYSIS ALGORITHM: Proposed method
OD’ of 1 ppb of compound at L=1154m Analysis conditions • Combination of concentrations [0-100ppb] • Spectral dispersion not allowed (i.e., linear fitting) • Proposed Method: width of windows, n=80 channels polynomial degree, r=3 • Classic implementation with Polynomial degree: [1-9] & binomial pre-filters • Proposed implementation with MATLAB RESULTS: Test on NO2 and Glyoxal + noise
NO2: Concentration error (%) ANALYSIS ALGORITHM: Results Cerror=(CTheo-Ccalc)/CTheo*100 No Pre-Filter Pre-Filter Pre-Filter Proposed Method
GLYOXAL: Concentration error (%) ANALYSIS ALGORITHM: Results No Pre-Filter Pre-Filter Proposed Method
NO2 355-408 nm disp=0.16 nm/ch Binomial filter:Classic n=80 channels, r=3:Proposed 306 – 408 nm Results: Test on NO2 (355 – 408 nm)
NO2 320-400 nm disp=0.16 nm/ch Binomial filter:Classic n=100 channels, r=3:Proposed Results: Test on NO2 (320 – 400 nm) Similar results using the best fitting parameters of the classical method and using the proposed method Strong dependence on the analysis range used in classic methodDEGREES OF FREEDOM REDUCED IN THE PROPOSED METHOD
COMPARATIVE CLASSIC vs PROPOSED ALGORITHM * ANALYSIS ALGORITHM: Conclusions MUCH HIGHER USER INTERVENTIONNEEDED IN CLASSIC THAN IN PROPOSED METHOD
ANALYSIS ALGORITHM: Future works • Test of the algorithm to analyse other compounds • Use of different polynomials or curves • Pre – processing of spectra to enhance features (e.g.. derivatives)
Thanks for your attention ACKNOWLEDGEMENTS: GENERALITAT VALENCIANA, BANCAJA, EUROCHAMP, AND ACCENT FOR SUPPORT.