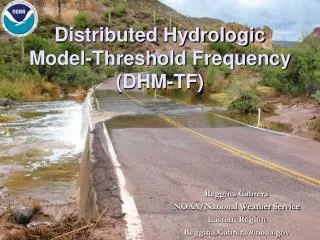
Distributed Hydrologic Model-Threshold Frequency (DHM-TF)
Distributed Hydrologic Model-Threshold Frequency (DHM-TF) . Reggina Cabrera NOAA/National Weather Service Eastern Region Reggina.Cabrera@noaa.gov. Tools. FFPI FFMPA DHM-TF. Concepts. NWS defines a flash flood as a flood that occurs within 6-hours of the causative event (rainfall)

Distributed Hydrologic Model-Threshold Frequency (DHM-TF)
E N D
Presentation Transcript
Distributed Hydrologic Model-Threshold Frequency(DHM-TF) Reggina Cabrera NOAA/National Weather Service Eastern Region Reggina.Cabrera@noaa.gov
Concepts NWS defines a flash flood as a flood that occurs within 6-hours of the causative event (rainfall) FFG is the depth of runoff over a given duration required to cause flooding in small streams. FFG procedures use regionally derived threshold at atungaged locations. These are flows that exceed bankfuljust enough to cause damage.
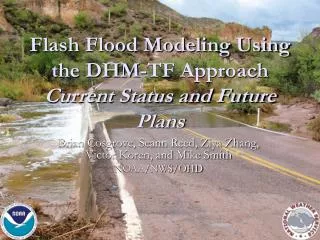
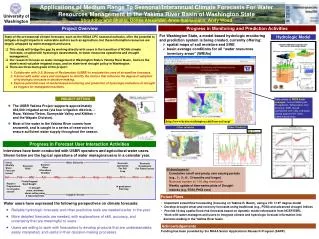
DHM-TF Modeling Approach Objective Improve flash flood forecast at ungaged locations by using a distributed hydrologic model with a frequency post-processor. Advantages: The proposed approach models flow and characterizes flood severity at ungaged locations It aids in the forecaster’s warning decisions
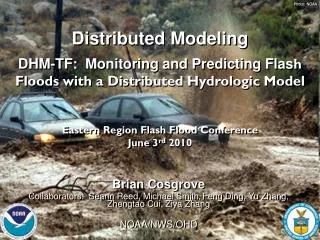
DHM-TF Modeling Approach • Spatial and temporal scales that are more commensurate with flash flooding Distributed models provide a framework for forecasting flashy events that occur at higher spatial and temporal resolutions than the lumped models used at the River Forecast Centers
Rainfall input data MPE- Multisensor Precipitation Estimator (observations at 4 km resolution, hourly) HPE- High Resolution Precipitation Estimator ( observations at 1 km resolution, hourly ) HPN- High Resolution Precipitation Nowcaster (forecasts at 4 km resolution, hourly)
The Process DHM produces gridded flow forecasts Gridded frequency (return period) forecasts are derived based on historical simulations Historical Simulations Conducted with DHM Same type of forcing data used as in forecast simulations to derive statistical parameters
Modeling Flash Floods Model Output Map of modeled flood frequencies NWS/OHD Implementation Sacramento model with kinematic routing Any model can be used that reasonably represents flow distribution
Statistical Component Post-Processor Statistical characteristics derived from historical simulations Gridded Flow Forecasts Gridded Frequency Forecasts
Maximum DHM-TF Return Period Values (Years) for August 9th Flash Flood Event (10Z 8/9/07 through 06Z 8/10/07) Standard Cell-to-Cell Routing Local Routing *Blue wave symbols indicate spotter-reported flash flood events • Overall, good match between areas of high DHM-TF return periods and spotter-reported events (wave symbols)
Return Period (years) 18Z 8/9/07 Return Period (years) 19Z 8/9/07 • Girty’s Run DHM-TF return periods (years) • 18Z-21Z August 9th 2007 • Standard • cell-to-cell routing method used • Return period values appear low given severity of flash flood event over Millvale *Blue wave symbols indicate spotter-reported flash flood events Return Period (years) 20Z 8/9/07 Return Period (years) 21Z 8/9/07
Return Period (years) 18Z 8/9/07 Return Period (years) 19Z 8/9/07 • Girty’s Run DHM-TF return periods (years) • 18Z-21Z August 9th 2007 • Local routing (unconnected) method used • Return period values appear low given severity of flash flood event over Millvale *Blue wave symbols indicate spotter-reported flash flood events Return Period (years) 20Z 8/9/07 Return Period (years) 21Z 8/9/07
Buffalo WFO Flash Flood Warning Buffalo (Blue Outline) DHM-TF Return Periods (years) for 13Z on 8/10/09 Real-time Verification Effort DHM-TF Computed Return Period (Years) Cell-to-Cell Routing Option Large DHM-TF return periods overlap with area of flash flood warning
Evaluation • Real-time Verification: Limited qualitative analysis has demonstrated that increased DHM-TF return periods generally match areas of heavy rain and flash flooding, while low DHM-TF return periods generally match non-flooded areas.