Download
1 / 27
270 likes | 383 Views
This study explores the local validation of numerical experiments conducted with the COSMO-EU model, focusing on the effects of root density and plant cover on soil moisture variations. It analyzes different experiments, including groundwater coupling and modified aerosol loading, conducted from March to May 2009 in Falkenberg, Payerne, and Toulouse. By adapting rooting depth to SEAWIFS-based plant cover and using real-world meteorological data, the study assesses the model's ability to simulate soil moisture dynamics during different seasonal conditions. Key findings highlight the critical role of vegetation parameters in accurate simulations.

E N D
Local validation of numerical experiments with the COSMO-EU G. Vogel and J. Helmert
Model experiments with COSMO-EU EXP CE 6795exponential depletion of root density with depth groundwater coupling bare soil evaporation (Noilhan & Planton, 1989) run without soil moisture analysis (SMA) EXP CE 7224 modified aerosol loading + SEAWIFS-based plcv and LAI areal pattern of minimum stomatal resistance (crsmin) groundwater coupling + modified rooting density profile + SMA EXP CE 7533 modified aerosol loading + SEAWIFS-based plcv and LAI areal pattern of halved minimum stomatal resistance (crsmin) groundwater coupling + modified rooting density profile + SMA Local validation of results at Falkenberg, Payerne and Toulouse (March - May 2009) (June 2009) (June 2009)
Impact of plant cover and rooting depth on temporal variation of soil moisture
modification standard parameterisation
Impact of plant cover and rooting depth on temporal variation of soil moisture
Impact of plant cover and rooting depth on soil moisture development during spring 2009
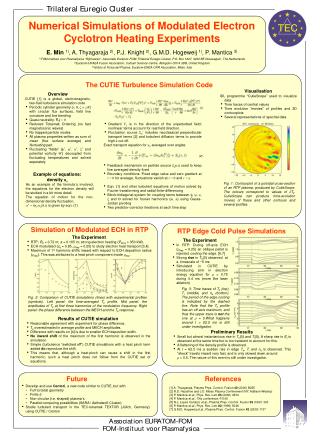
Richard equation for water transfer Transfer functions according to Rijtema (1969) Variants of the lower boundary conditions (rigid lid, standard drainage and complete groundwater coupling) should be considered in the D-Term
0cm - 9cm sand 9cm – 27cm loam no vegetation standard drainage Forcing data taken from Falkenberg 2003
The TERRA module simulates the soil moisture decrease during spring reasonably well if the local vegetation properties are realistically prescri-bed. Crucial vegetation parameters are the rooting density and depth as well as the minimum stomatal resistance. If satellite-based values are used, the rooting depth should also be made consistent to them in the annual cycle. The TERRA module is likewise able to simulate the water transfer under inhomogeneous soil conditions after some modifications of the transfer scheme. Conclusions
D:\IDL\Moscow\sm_FKB_MAM2009.jpg Lindenberg Meteorological Observatory – Richard Aßmann Observatory COSMO GM Moscow September 2010
Falkenberg 2009 Lindenberg Meteorological Observatory – Richard Aßmann Observatory COSMO GM Moscow September 2010
Falkenberg 2009 Lindenberg Meteorological Observatory – Richard Aßmann Observatory COSMO GM Moscow September 2010
Lindenberg Meteorological Observatory – Richard Aßmann Observatory COSMO GM Moscow September 2010
*0.58 *2.00
Accumulated evapotranspiration Bowen-ratio (9-15 UTC) Lindenberg Meteorological Observatory – Richard Aßmann Observatory COSMO GM Moscow September 2010
Adaption of rooting depth to SEAWIFS-based plant cover in the annual cycle rootdp_min = 0.12m (or e.g. half of maximum value) rootdp_max= 0.60 m (see look-up table) plcovSEAWIFS current plant cover value from SEAWIFS plcv_minSEAWIFS minimum plant cover from SEAWIFS in the annual cycle Plcv_avgSEAWIFS averaged maximum plant cover from SEAWIFS values (June – August) Lindenberg Meteorological Observatory – Richard Aßmann Observatory COSMO GM Moscow September 2010
Maximum values (plcov, lai, rootdp) rv dv quadratic interpolation quadratic interpolation ev bv Minimum values (plcov, lai, rootdp) Minimum values (plcov, lai, rootdp) annual cycle Parametrisierung des Jahresgangs bv,dv = functions of latitude jd=1,365 jd: Julian day hsurf: height above sea level bv: start of season (2009: 85) dv: vegetation developed (2009: 115) rv: veg. begins to „redevelop“ (2009: 215) ev: end of season (2009: 238)
Payerne Falkenberg Toulouse 0 - 0.30m 0 - 0.30m 0 – 1.00m Sl3 field capacity 26 V% pore volume 37 V% 22.8 M% clay 32.0 M% sand 0.30 - 0.60m 0.30 - 0.80m 26 M% clay, 74 M% sand preliminary field capacity 28 V% Slu pore volume 36 V% 0.60 - 1.20m 40 M% clay, 60 M% sand field capacity 24 V% pore volume 34 V% wilting point 11 V%
0cm - 9cm sand 9cm – 27cm loam no vegetation standard drainage Forcing data taken from Falkenberg 2003