Download
1 / 36
360 likes | 494 Views
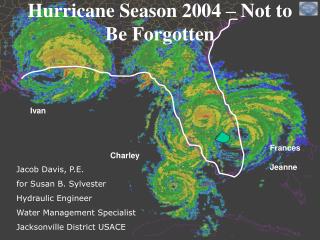
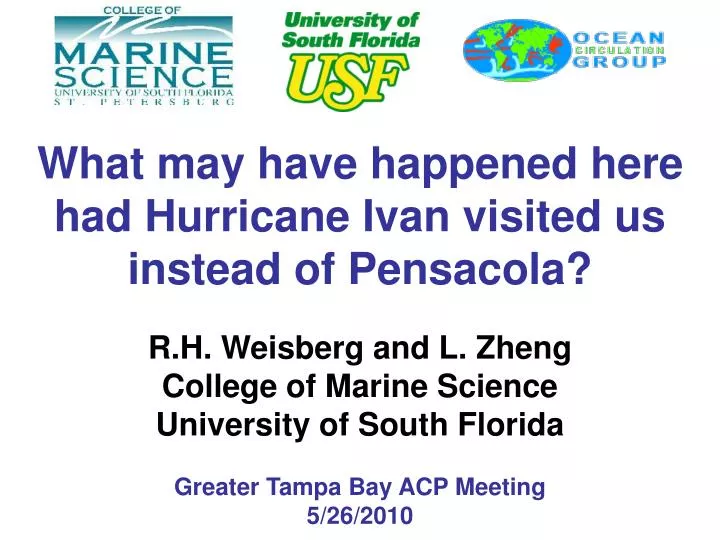
What may have happened here had Hurricane Ivan visited us instead of Pensacola?. R.H. Weisberg and L. Zheng College of Marine Science University of South Florida Greater Tampa Bay ACP Meeting 5/26/2010. What is storm surge? Abnormal sea level change caused by wind and pressure.

E N D
What may have happened here had Hurricane Ivan visited us instead of Pensacola? R.H. Weisberg and L. Zheng College of Marine Science University of South Florida Greater Tampa Bay ACP Meeting 5/26/2010
What is storm surge? Abnormal sea level change caused by wind and pressure. 1. Along shore wind stress. A sea level slope balancing the Coriolis force of an alongshore current causes sea level to set up by ~ 1 - 3 ft. 2. Atmospheric pressure. The inverted barometer effect causes sea level to set up by ~ 1 - 3 ft. 3. Across shore wind stress. A sea level slope balancing friction causes sea level to set up by as much as 28 ft. This is the largest contributor to hurricane storm surge. Other factors: 4. Coastal geometry. 5. Continental shelf width. 6. Tides. 7. Water density. 8. Waves. Waves when added to the surge are the most destructive aspect of hurricane storm surge.
Rte 90 bridge across Bay St. Louis, MS. All spans were knocked from their supports.
Why should we study the potential for Tampa Baystorm surges? 1. The Southeast U.S. is regularly hit by hurricanes. 2. Whereas Tampa Bay has not had a major direct hurricane hit since 1921 it seems inevitable that one will again occur. 3. In the meanwhile population and coastal development have burgeoned. 4. Because of low land elevations, the potential for property damage and loss of life is severe.
Storm Tracks: 1851-2005 Figure provided by J. I. Virmani, 2007
Storm tracks by month Figure provided by J. I. Virmani, 2007
Storm Tracks: 1851-2006 270-28.50N, 820-830W Figure provided by J. I. Virmani, 2008
Potential for Tampa Bay area inundation is large due to land elevation and geometry Inundation based on uniform sea level rise of: 5 ft 20 ft
Hurricane Storm Surge Simulation Requirements • 1. A high resolution, physics-based circulation model with flooding and drying capabilities. • 2. A high resolution water depth (bathymetry) and land elevation data set on which to overlay the model. • Accurate enough wind and pressure fields to drive the model. • Here we use the Finite Volume Coastal Ocean Model (FVCOM) of Chen et al. (2003).
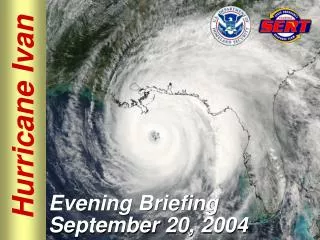
The Ivan track (red dots) and the tracks (black dots) used in this study (with landfalls as Sarasota, Indian Rocks Beach, Tarpon Springs, Bayport, and Cedar Keys.
Ivan Winds on approach and at Landfall While Ivan reached category 5 in the Caribbean it was a 4 upon approach and a 3 at landfall. Categorymphknotsm/s 1 74-95 64-82 33-43 2 96-110 83-95 44-49 3 111-130 96-113 50-59 4 131-155 113-135 60-70 5 >155 >135 >70
Relative Elevations (Approximate) Seawall height(and nominal street level): 5’ above mean low water (MLW); 4’ above mean sea level (MSL); Finished floor heights: 9’ and 11’ above MLW for old and new building codes (8’ and 10’ above MSL (7’ and 9’ above MHW); hence a 2.5m (3m) surge would put water in an older (newer) home. New building code Old building code Seawall and road levels 11 ft 9 ft 4 ft Meters and Feet 1m = 3.28 ft 3m = 9.84 ft 6m = 19.68 ft 5 ft MSL 1 ft MLW
Surge height relative to mean sea level (left) and land elevation (middle), plus wind vectors and speeds (right) 3 hours before and at landfall.
Maximumsurge heights relative to land elevations at St. Pete Be. (left), Old Tampa Bay (middle), and Hillsborough Bay (right).
2.75 - 3.0 m (msl) 9 - 10 ft (msl) 3 - 5 ft (le) 3.75 - 4 m (msl) 12 - 13 ft (msl) 6 - 8 ft (le) 4 – 4.25 m (msl) 13 - 14 ft (msl) 7 - 9 ft (le) 3.75 - 4 m (msl) 12 - 13 ft (msl) 6 - 8 ft (le)
Anim. of surge height relative to land elev. (L) and winds (R)
Are surges simulated with 3D models different from those simulated with 2D models? • Why bother: Agencies use 2D models (e.g., NOAA: SLOSH; FEMA and USACE: ADCIRC). • Whereas storm surge dynamics are 3D: • The problem is: 2D dynamics overestimate bottom stress and therefore underestimate surge height.
Absolute (black) and percent (red) differences between 3-D and 2-D surges at four positions from the mouth to the head of the bay.
Coupled Wave Effects To investigate the effects of waves on the combined surge and waves we coupled a waves model (SWAN) to the circulation model (FVCOM) and repeated the experiments. The following figures show: 1) significant wave height, radiation stress and wind stress at several times during the simulation, 2) surge heights with and without the wave coupling by radiation stress, and 3) surge height differences with and without the wave coupling. To the surge heights with wave coupling must also be added the wave amplitude (between approximately 0.5 to 0.7 times the wave height) to get the total vertical reach of water over the evolution of the storm.
2.5 - 3 m 8 – 10 ft
Katrina damage to Long Beach MS, where surge heights were ~ 20 ft and waves were ~ 6 ft. Houses at elevations less than about 16 ft were destroyed.
Katrina damage to Pascagoula MS, where surge heights were ~ 14 ft and waves were ~ 4 ft.
ENCORE (Presented 6/06 at WFAMS and 7/07at TBRPC) The worst case for Tampa Bay as a whole is not necessarily the worst case for any given position within the bay. Now consider the inundation potential for downtown Tampa under a category 5 hurricane paralleling the bay axis and displaced northwest by a radius to maximum winds, such that the maximum winds are directed toward the head of Hillsborough Bay.
Conclusions • Local: • Tampa Bay, FL is asvulnerable to hurricane storm surge inundation as was coastal Mississippi for H. Katrina. • 2. General: • Storm surge simulation is not a solved problem. It is sensitive to model construction: i.e., 3-D, versus 2-D and surface and bottom stresses, which remain uncertain. • Agencies (NOAA, FEMA, USACE) employ 2-D models. Our findings suggest the importance of 3-D. • Studies are necessary to improve surface and bottom stress parameterizations. • 3. Finally: • Residual risk is real, e.g., Katrina. Don’t underestimate the importance of flood insurance, even if you are above the FEMA BFE, and heed emergency manager’s warnings!


![[The Hurricane]](https://cdn1.slideserve.com/1952424/the-hurricane-dt.jpg)