Download
1 / 50
510 likes | 536 Views
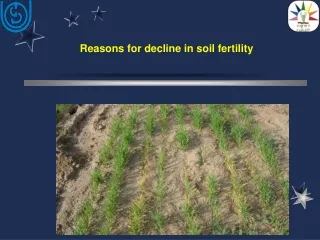
Learn about soil fertility, nutrient benefits and risks, the nitrogen cascade, greenhouse gases, and best management practices for sustainable agriculture.

E N D
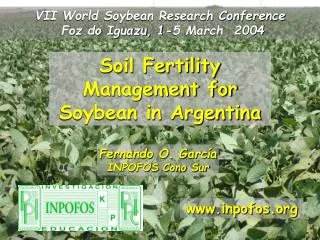
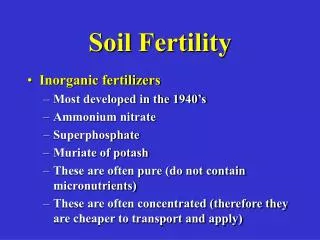
Soil Fertility Resources for Extension Agents National Association of County Agricultural Agents Annual Meeting and Professional Improvement Conference 24 July 2006 Cincinnati, OH Tom Bruulsema, PhD Northeast Director Potash & Phosphate Institute
Atmosphere Stratospheric Effects PM & Visibility Effects Ozone Effects NOx Greenhouse Effects Energy Production Terrestrial Ecosystems N2O NOx NH3 Food Production NHx Agroecosystem Effects Forests & Grassland Crop Animal People (Food; Fiber) Soil Soil Norg NO3 Groundwater Effects Human Activities The Nitrogen Cascade Stream & River Effects Coastal Effects N2O Galloway & Cowling, 2002 Aquatic Ecosystems --Indicates denitrification potential
Hypoxic Area in Gulf of Mexico Square miles No Data 15 Hypoxia data by N. Rabalais, LUMCON
European Project for Ice Coring in Antarctica Science 25 November 2005Vol. 310. no. 5752, pp. 1285 - 1287
Greenhouse Gases N2O
Improvement: % P: 108% N: 43% K: 90% Source: USDA-NASS; PPI Corn Yield: 55%
85 28 Galloway and Cowling, 2002
Best Management Practices Right rate Right time Right place
Who Needs to Know? • Everyone! • Soil Fertility Specialists • Producers • Policymakers and Regulators • Public – young & old
A complete course in soil fertility • All 17 essential elements • Color slides • Nutrient deficiency symptoms
Powerpoint Presentations • Phosphorus Nutrition • Alfalfa • Canola • Corn • Cotton • Wheat • Potassium Nutrition • Alfalfa • Cotton • Northern Great Plains
Quality for Health • Agriculture’s connection to food • Take a Closer Look • Fertilizer and Tofu • Functional Foods research • Fertilizer Impacts on Quality
Soil Test Levels in North America, 2005PPI/PPIC/FAR Technical Bulletin 2005-1
Figure 1. Fraction of Samples Analyzed by Specific P and K Soil Tests
North America Figure 4. Soil test P frequency distribution for North America in 2005.
Figure 7. Soil test K frequency distribution in 2001 and 2005.
Soil Test Interpretation • Why not one recommendation for a given soil test level?
Summary • Approximately 3.4 million samples from 70 laboratories are included in the summary • Results indicate the importance of regular soil testing because a large number of samples test in or near critical soil test ranges where nutrient recommendations vary greatly • Median P level is 31 ppm, with 41% of samples for 2005 crop year testing less than 25 ppm • Median K level is 154 ppm, with 33% of samples testing less than 120 ppm, and 53% less than 160 ppm • Median pH for U.S. and Canada is 6.3, with 31% of samples testing < 6.0 • Need for soil testing is important to determine fertility status of specific fields
BMPs for Efficient Fertilizer Use 12 basic tips
Fertilizer BMPs1. Measure what the soil can provide2. Consider crop removal3. Set realistic yield goals4. Use all nutrient sources available
Fertilizer BMPs5. Keep the proper balance of nutrients6. Manage soil pH7. Manage for maximum economic yield8. Time applications MEY
Fertilizer BMPs9. Control release10. Band in the right place11. Test on-farm 12. Consult a credible adviser
PPI Tools on the Web • www.ppi-ppic.org • Crop Nutrient Response Tool • PKalc • Hybrid Maize • Fertilizer Chooser
3 7 6 4 1 5 2