Understanding Clustering Methods in Data Analysis
1.21k likes | 1.3k Views
Explore Support Vector Machines, Distance Weighted Discrimination, Hierarchical Clustering, and SWISS Score concepts using toy examples, with a focus on distinguishing melanoma data subclasses and bioinformatics application.

Understanding Clustering Methods in Data Analysis
E N D
Presentation Transcript
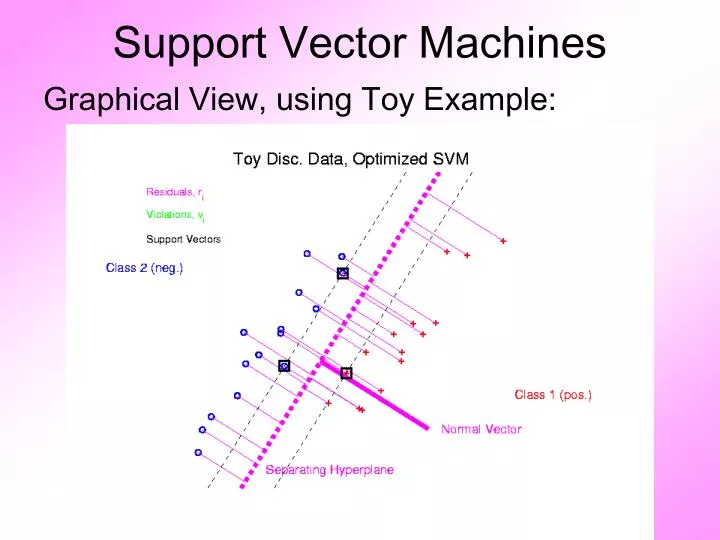
Support Vector Machines Graphical View, using Toy Example:
Distance Weighted Discrim’n Graphical View, using Toy Example:
HDLSS Discrim’n Simulations Wobble Mixture:
HDLSS Discrim’n Simulations Wobble Mixture: 80% dim. 1 , other dims 0 20% dim. 1 ±0.1, rand dim ±100, others 0 • MD still very bad, driven by outliers • SVM & DWD are both very robust • SVM loses (affected by margin push) • DWD slightly better (by w’ted influence) • Methods converge for higher dimension?? Ignore RLR (a mistake)
Melanoma Data • Study Differences Between (Malignant) Melanoma & (Benign) Nevi Use Image Features as Before (Recall from Transformation Discussion) Paper: Miedema et al (2012)
Introduction Background Clinical diagnosis
ROC Curve Slide Cutoff To Trace Out Curve
Melanoma Data Subclass DWD Direction
Melanoma Data Full Data DWD Direction
Melanoma Data Full Data ROC Analysis AUC = 0.93
Melanoma Data SubClass ROC Analysis AUC = 0.95 Better, Makes Intuitive Sense
Clustering Idea: Given data • Assign each object to a class • Of similar objects • Completely data driven • I.e. assign labels to data • “Unsupervised Learning” Contrast to Classification (Discrimination) • With predetermined classes • “Supervised Learning”
K-means Clustering Clustering Goal: • Given data • Choose classes • To miminize
2-means Clustering Study CI, using simple 1-d examples • Over changing Classes (moving b’dry) • Multi-modal data interesting effects • Local mins can be hard to find • i.e. iterative procedures can “get stuck” (even in 1 dimension, with K = 2)
SWISS Score Another Application of CI (Cluster Index) Cabanski et al (2010)
SWISS Score Another Application of CI (Cluster Index) Cabanski et al (2010) Idea: Use CI in bioinformatics to “measure quality of data preprocessing”
SWISS Score Another Application of CI (Cluster Index) Cabanski et al (2010) Idea: Use CI in bioinformatics to “measure quality of data preprocessing” Philosophy: Clusters Are Scientific Goal So Want to Accentuate Them
SWISS Score Toy Examples (2-d): Which are “More Clustered?”
SWISS Score Toy Examples (2-d): Which are “More Clustered?”
SWISS Score SWISS = Standardized Within class Sum of Squares
SWISS Score SWISS = Standardized Within class Sum of Squares
SWISS Score SWISS = Standardized Within class Sum of Squares
SWISS Score SWISS = Standardized Within class Sum of Squares
SWISS Score Nice Graphical Introduction:
SWISS Score Nice Graphical Introduction:
SWISS Score Nice Graphical Introduction:
SWISS Score Revisit Toy Examples (2-d): Which are “More Clustered?”
SWISS Score Toy Examples (2-d): Which are “More Clustered?”
SWISS Score Toy Examples (2-d): Which are “More Clustered?”
SWISS Score Now Consider K > 2: How well does it work?
SWISS Score K = 3, Toy Example:
SWISS Score K = 3, Toy Example:
SWISS Score K = 3, Toy Example:
SWISS Score K = 3, Toy Example: But C Seems “Better Clustered”
SWISS Score K-Class SWISS: Instead of using K-Class CI Use Average of Pairwise SWISS Scores
SWISS Score K-Class SWISS: Instead of using K-Class CI Use Average of Pairwise SWISS Scores (Preserves [0,1] Range)
SWISS Score Avg. Pairwise SWISS – Toy Examples
SWISS Score Additional Feature: Ǝ Hypothesis Tests: • H1: SWISS1 < 1 • H1: SWISS1 < SWISS2 Permutation Based See Cabanski et al (2010)
Clustering • A Very Large Area • K-Means is Only One Approach
Clustering • A Very Large Area • K-Means is Only One Approach • Has its Drawbacks (Many Toy Examples of This)
Clustering • A Very Large Area • K-Means is Only One Approach • Has its Drawbacks (Many Toy Examples of This) • Ǝ Many Other Approaches
Clustering Recall Important References (monographs): • Hartigan (1975) • Gersho and Gray (1992) • Kaufman and Rousseeuw (2005) See Also Wikipedia
Clustering • A Very Large Area • K-Means is Only One Approach • Has its Drawbacks (Many Toy Examples of This) • Ǝ Many Other Approaches • Important (And Broad) Class Hierarchical Clustering
Hiearchical Clustering Idea: Consider Either: Bottom Up Aggregation: One by One Combine Data Top Down Splitting: All Data in One Cluster & Split Through Entire Data Set, to get Dendogram
Hiearchical Clustering Aggregate or Split, to get Dendogram Thanks to US EPA: water.epa.gov
Hiearchical Clustering Aggregate or Split, to get Dendogram Aggregate: Start With Individuals, Move Up
Hiearchical Clustering Aggregate or Split, to get Dendogram Aggregate: Start With Individuals
Hiearchical Clustering Aggregate or Split, to get Dendogram Aggregate: Start With Individuals, Move Up
Hiearchical Clustering Aggregate or Split, to get Dendogram Aggregate: Start With Individuals, Move Up