Download

1 / 24
240 likes | 370 Views
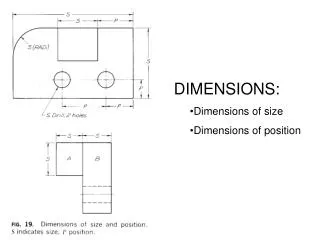
Data Dimensions. Data Dimensions Properties by which data cubes are described. For example, measures in a SALES cube can be reported by TIME, PRODUCT, REGION, SALESPERSON, etc. Data Cube

E N D
Data Dimensions • Data Dimensions • Properties by which data cubes are described. For example, measures in a SALES cube can be reported by TIME, PRODUCT, REGION, SALESPERSON, etc. • Data Cube • A multi-dimensional representation of data in which the cells contain measures (i.e. facts) and the edges represent data dimensions by which the data may be reported (sliced and diced). For example: A SALES cube can have measures "PROFIT" and "COMMISSION". • Data • Unprocessed raw information. Data is normally stored in a database or a file. • Information • Information is the result of processing, manipulating and organizing data in a way that adds to the knowledge of the person receiving it. • Dimension Table • A table, typically in a data warehouse, that contains further information about an attribute in a fact table. For example, a SALES table can have the following dimension tables TIME, PRODUCT, REGION, SALESPERSON, etc. Also see Data Dimensions. • Fact Table • A table, typically in a data warehouse, that contains the measures and facts (the primary data). Also see Dimension Table.
Aggregation • A process of grouping distinct data. The aggregated data set has a smaller number of data elements than the input data set.
9.2.2.7 BBOX • The BBOX is the spatial constraint expressed as a box (parallelepiped) aligned with the axes of the spatial reference system given in the CRS parameter. The numbers represent the the coordinates of the southwest/lower and northeast/upper corners (in that order) as comma-separated numbers (e.g., minx, miny, maxx, maxy, ). • Each corner’s coordinate(s) must be expressed in the order and units given by the CRS. Data must be returned for any coverage that is partly or entirely contained in the BBOX. • NOTE The order (southwest, northeast) often corresponds to (minimum x, minimum y, maximum x, maximum y) – but this is not always the case. For instance, when a Bounding Box expressed in longitude and latitude crosses the antimeridian (the meridian with longitude +/-180 degrees), its northeast corner’s longitude is often less than that of its southwest corner. • A GetCoverage request must include a valid BBOX, or TIME (below), or both. • GetCoverage requests should retrieve meaningful data from the Coverage Offering if their spatial or temporal con-straints (BBOX or BoundingBox, TIME, or Time) intersect the locations or times described in domainSet.
FYI, In our GML-based Climate Science Modelling Language (CSML), we extended the gml:Grid type to deal with irregularly speaced (but rectangular) grids by explicitly providing ordinate values of grid points, rather than the 'offset' vectors appropriate for rectified grids. We also included an efficiency mechanism for the case where grid axes are aligned with coordinate system axes (i.e. non-rotated, but still irregular). The gory details (and they are) are in Sect 4.2.2 of the User's Manual at http://ndg.nerc.ac.uk/csml/UsersManual.pdf, with an example below. We think this model is a useful candidate for a future revision of GML. <Grid srsName="urn:EPSG:geographicCRS:4326" srsDimension="2" dimension="2"> <gml:limits> <gml:GridEnvelope> <gml:low>-3 -2</gml:low> <gml:high>3 2</gml:high> </gml:GridEnvelope> </gml:limits> <gml:axisName>gridI</gml:axisName> <gml:axisName>gridJ</gml:axisName> <ordinate> <gridAxesSpanned>gridI gridJ</gridAxesSpanned> <sequenceRule order="+y+x">Linear</sequenceRule> <definesAxis xlink:href="#Lat"/> <axisValues>-3.54 -2.83 -2.12 -1.41 -0.70 -2.83 -2.12 -1.41 -0.707 0 -2.12 -1.41 -0.707 0 0.707 -1.41 -0.707 0 0.707 1.41 -0.707 0 0.707 1.41 2.12 0 0.707 1.41 2.12 2.83 0.707 1.41 2.12 2.83 3.54</axisValues> </ordinate> <ordinate> <gridAxesSpanned>gridI gridJ</gridAxesSpanned> <sequenceRule order="+y+x">Linear</sequenceRule> <definesAxis xlink:href="#Long"/> <axisValues>-0.707 -1.41 -2.12 -2.83 -3.54 0 -0.707 -1.41 -2.12 -2.83 0.707 0 -0.707 -1.41 -2.12 1.41 0.707 0 -0.707 -1.41 2.12 1.41 0.707 0 -0.707 2.83 2.12 1.41 0.707 0 3.54 2.83 2.12 1.41 0.707</axisValues> </ordinate> </Grid> • Non-Recitied grid • I am pleased that this has raised this question of Gaussian grids! We have rectified the • grid in X-Y for our datasets, but we have abused the describeCoverage XML to explain the • Z dimension as follows • <RangeSet> • <description>0.09999999403953552 0.19999998807907104 0.30000001192092896 0.5 0.699999988079071 1.0 2.0 3.0 5.0 7.0 10.0 20.0 30.0 50.0 70.0 100.0 150.0 200.0 250.0 300.0 400.0 500.0 600.0 700.0 850.0 975.0 1000.0 </description> • <name>bands</name> • <label>Pressure (hPa units) Levels</label> • <axisDescription> • <AxisDescription> • <name>bands</name> • <label>Bands/Channels/Samples</label> • <values> • <singleValue>1</singleValue> • <singleValue>2</singleValue> • <singleValue>3</singleValue> • <singleValue>4</singleValue> • <singleValue>5</singleValue> • <singleValue>6</singleValue> • So that when you use the kvp BANDS then the client by indexing into the space-separated description list can calculate which physical level this corresponds to. • This is not an ideal solution, and I welcome comments on how we can go about changing this. Rectifying the grid to evenly spaced means a change to the original dataset (though it is necessary to make geotiff). • Hopefully this will be something that we can push into the GML in JPEG2000 coverage format. • Norman > >To the best of my knowledge there is no GML well defined > mechanism to > >describe such a grid. Please describe to the list if you > find a way of > >doing so. > > That's correct - the definition of the RectifiedGrid element follows ISO 19136, which specifies grids with constant spacing along each axis. There is just one offsetVector per dimension. The ISO 19123 ReferenceableGrid is a more general object, which maps grid coodinates (i.e. integer coordinates) to an external corodinate reference system, but it is defined in terms of operations only, with no limitation on how it might be implemented (function, lookup, etc). For obvious reasons, this is not implemented in GML In order to specify a regular grid with non-constant offsets, a new specialization of CV_Grid/gml:Grid would be required. Not hard conceptually - just replace the single offsetVector on each axis with an ordered list of vectors. (Of course there are various kinds of constraints you might want to apply - e.g. are all vectors on one axis are parallel, or not?) Simon
Separate Coverage processing service. I feel uncomfortable about a WCS that more or less silently does an interpolation. It also contradicts the WCS preamble that stresses the original data quality. IMHO any interpolation should be explicit to the requestor. So the consequence for me is that functionality should be available that allows to generate inbetweenings. My suggestion is to put such functionality not into a WCS 1.1, but into the WCPS (Web Coverage Processing Service) recently proposed where a coverage language allows to arbitrarily combine request facets. WCS I think would suffer from too much changing it (some reasons: we see change requests coming up in line, with many desirable operations - where is the limit, are they mutually axclusive or combined, and in particular: how stable can WCS get?). -Peter • John CARON I agree strongly that WCS should be capable of serving out the data unchanged. This is what attracted Unidata to trying WCS. The WCPS proposal seems on the surface a reasonable way to factor things, but i havent had time to understand it in any detail.After working with WCS a bit, I was getting the feeling that the designers were greatly influenced by the WMS, which allows clients to specify exactly what they want (resolution, bounding box, projection, etc). This is a nice feature for clients, for sure, but not so easy for servers, and not focused on serving out the raw data. And of course as you point out, there are so many services a client might want.In pursuit of that, for example, our server can send out geotiff with the data in floating point "Data Sample" format, even though geotiff readers are not required to be able to read this.Anyway, Im glad that others are also interested in focussing on "original data quality".
Dataset=sst.nc • > there is another problem that Stefano pointed out. I am requiring a KVP > dataset=sst.nc. This appears to not be kosher w/respect to WCS spec. > Does anyone have any opinions on that? What do other servers when they > have many datasets to serve? This is allowed by the spec (section 6.3.1). We have also seen this used frequently for WMS and WFS. Regards, Martin • Yang: As far as I know "dataset" is not a well defined key in WCS 1.0 so it should not be added to the WCS request. Section 9.2.2.1 and table 9 of WCS 1.0 specification give all the valid keys. We use "coverage" instead. • Hi Yang: • Martin; Its definitely not specified, the question is whether its prohibited. The "coverage" parameter names a field within the dataset; but i have • many datasets that I can serve, and the client needs to tell me which one to use, so thats why i used a dataset parameter. • I changed my server to name the dataset in the URL path instead of a dataset KVP for several reasons, not just the question of whether the • spec allows it, so Im going to leave my server without it. • However, it does seem to me that the point of specifying the URLs in the DCP element is to allow any such needed parameters, so i would advocate • allowing these; the client could just consider it a base URL and not look too hard at it. Caron I previously removed the dataset parameter to the WCS server, in favor of using the URL path to identify which _local_ dataset to serve.Now Ive been asked to allow the WCS server to serve remote datasets, eg OPeNDAP datasets on another server. For this, I dont see any other good way to specify the dataset.Heres a snippet of some preliminary documentation. Comments welcome. You can try this out on motherlode if you want (the example dataset is rather large and slow, but pretty).-------------------------A slight extension of the WCS Dataset URL format allows us to serve remote datasets. Identify the dataset by adding the parameter dataset whose value is a URL:http://servername:8080/thredds/wcs?dataset=datasetURL&;The URL must be a dataset readable by the NetCDF-Java library, typically an OPeNDAP dataset on another server. It must have gridded data, with identifiable coordinate systems, etc. For example, an OPeNDAP URL ishttp://las.pfeg.noaa.gov/cgi-bin/nph-dods/data/oceanwatch/nrt/gac/AG14day.ncThis can be served remotely as a WCS dataset with this URL:http://servername:8080/thredds/wcs?dataset=http://las.pfeg.noaa.gov/cgi-bin/nph-dods/data/oceanwatch/nrt/gac/AG14day.nc&;
0-360 range Finally, the 0 to 360 range doesn't seem to be a problem - at least for ur client - because the result of the request, below, is a GeoTIFF with coords in the -180 to 180 range, and we trust that. I must admit to being a bit uncomfortable with the discrepancy though, and would prefer the -180 to 180 range throughout. I think that that would maximise interoperability.Sometimes I think half of my code is spent dealing with a cylindrical earth!One problem with requiring a fixed range like [-180,180], is that its when representing areas that cross the the seam, the left coordinate is less than the right. So you need to also clarify that the area included is easternly from the first point (or something like that). I cant say the schema makes that clear in my mind: Martin >>My interoperability concern is more for the case when the extents don't go outside to [0,180] and [0,90] range. How can a client know whether this is right or left of the prime meridian, or above or below the Equator?> we always assume + means north, east, and - means south, westSorry, I didn't explain myself very well. What I meant was, if the full extents of the coverage are in the range [0,180] and [0,90], then the client has no way of knowing what the origin is. That is, the client could detect longitudes > 180 and latitudes > 90 and deduce that the server is using the [0,360] and [0,180] ranges. But that hueristic breaks down for smaller extents. Like I said, the extents ranges should probably respect the CRS extents and origin. That way there is no guesswork involved. Just trusting the results might not be enough. For example, our client allows the user to clip the coverage request to the extents of the current view. We need the current view extents and the coverage extents to either be in the same domain, or to be able to know the domains. Regards, Martin
0-360 Jun4 26 This reminds me of a question Ive been meaning to ask.Suppose the client asks for an area that is bigger than the actual data area. I assume that we should return the intersection?What if the client asks for an area that doesnt intersect? Is that an illegal request? Do we return an empty file?my spontaneous reaction: both is an error. The spatial extent is advertised, and the client must keep with that. Otherwise we more and more deviate from the correlation between what is being asked and what is being returned.I don't feel happy with an empty file - if this indicates a nonregular situation, it should be flagged as such = an error code should be returned.Otherwise the client, in particular a non-leight-weight one, may run into dozens of case distinctions before being able to really process what's been received. My personal opinion is that this would take away some elegance and clarity from WCS.I know that WMS also allows a "far zoom out", which may be nice for viewing (well...some people may think so), but again: the primary mission of WCS IMHO is to serve _original_ data. just my 2 cents... -Peter • Simon: This touches on one of those OGC permathreads, which could be summarized as "why should I worry about the CRS definition - if I don't say anything then everyone will know it is lon-lat WGS 84 won't they" to which the answer is, unfortunately, "no". • There are distinct traditions in different sub-sectors of our world where the sub-community actually makes different assumptions from other sub-communities. For example, the good-old cartographers tradition is lat-lon (i.e. northing before easting) with numbers in sexadecimal + hemisphere (DMSH). A commonly used map projection in South Africa is based on southing and westing. And most data in Australia is still given using a datum which offsets everything 200m from WGS84. Unfortunately, the only safe way is the explicit way. This includes not only datum and projection parameters, but also axis order, axis direction, and possibly encoding. Andrew: Simon, Your suggestion is essentially what we do in CSML for non-rectified grids: - inherit from gml:Grid - add an element to specify the (non-uniform) axis values at grid nodes for each CRS axis - allow any CRS axis to span one or more grid dimensions (grid axes not necessarily aligned with - or affinely related to - CRS axes) The last allows, for example, a two-dimensional grid to be embedded within three-space dimensions. Or - more typically - a two-dimensional grid to be arbitrarily placed within horizontal space. Numerical climate models often have grids with non-affine relationship to lat-lon (or any other standard) CRS. Regards, - Andrew Simon
Norman / Denis, • I agree that attaching the dimension value(s) unrolled as bands as band metatadata would be desirable. I would like to help wrap this into MapServer WCS if possible, if I am missing something with my comments above please let me know. This is great though, is has caused great excitement in our office! • Are you interested in having GDAL write netCDF files so that MapServer can return netCDF files? As far as I know, there is no support for creation/writing in the generic netcdf module in GDAL but it seems like it might not be that hard to implement. Ideally having MapServer return netCDF would be a nice to have, but as we have discussed before about 3D BBOX + parameters (and this is an aim of OGC GALEON), there is little to differentiate between a geotiff and a netCDF file (or any banded file) when implemented this way (2D + bands for the z-level). If we could access netCDF through MapServer in an ND sense it would be different, I hope this is something we can work through in GALEON. It is still possible to make a very workable WCS with 2D + bands though, and I am interested in a way to keep the metadata within the file. • However most of the work (for example when you have 40TB of data as our domain user does!) is in the conversion, so having gdal and hence MapServer read CF netCDF is a major plus (really good!), and makes using MapServer WCS even easier. • This is great though, I am compiling up MapServer with this new GDAL as we speak! Hats off to Denis and Frank! Norman • Title: MessageThis is great news, a good step along the road we're all headed. Norman mentioned what is also the end game for us - the WCS *spec* supports arbitrary 1-,2-,3- or 4-d slices in a fully 4-d dataset, eg: • 3-d volume (lat-lon-height): http://glue.badc.rl.ac.uk/cgi-bin/mapserv?REQUEST=GetCoverage&SERVICE=WCS&Version=1.0.0&Coverage=temperature&BBOX=-180,-90,179,90,0,1000&CRS=some3dCRS&FORMAT=CF-netCDF • Hovmuller (lat vs time): http://glue.badc.rl.ac.uk/cgi-bin/mapserv?REQUEST=GetCoverage&SERVICE=WCS&Version=1.0.0&Coverage=temperature&BBOX=10,-90,10,90,500,500&TIME=1996/2005/1&CRS=some3dCRS&FORMAT=CF-netCDF • Vertical slice through atmosphere (lat vs height): http://glue.badc.rl.ac.uk/cgi-bin/mapserv?REQUEST=GetCoverage&SERVICE=WCS&Version=1.0.0&Coverage=temperature&BBOX=10,-90,10,90,0,1000&CRS=some3dCRS&FORMAT=CF-netCDF • These are all *valid WCS requests*!!! My understanding, however, is that fundamental 2-D limitations in GDAL will make this extremely difficult to achieve in Mapserver - any views to the contrary? • Norman: Pleased to report this works fine with MapServer, reading netCDF files directly from disk. I compiled the c netcdf libraries from unidata, then gdal, then mapserver, all worked fine. • I am finding that gdal isn't picking up any geographic coordinate information from the netcdf files, despite them having a geogrid, I am putting this in by hand in the map file. • The WCS getCoverage query worked, returning what was a netCDF file on disk as a floating point geotiff. • This is really good, thanks, once I have got fully working on the production system, I will update the howto on the MapServer web site for WCS. Norman Coord disc Aug 18
5-5D Data I think we need to be thinking either about making GDAL more interested in 3D/4D datasets, as that's coming whether we're ready or not... in fact, for me, it's already here.. and then see if we need to consider forking or augmenting Mapserver to accommodate it.I see a lot of conceptual problems for Mapserver, and, for that matter, a LOT of GIS packages in incorporating 3D/4D data, and presenting it properly. This has been an issue for GIS practitioners since just about forever: They think in 2 dimensions and can't, as a group, appreciate the need for either vertical, or time. They represent time series data as a series of static images.I see, in Mapserver, a potential interface. It's open-source and thus maleable for applications like this. It won't be simple or straightforward, and in the end, Mapserver might serve solely as an example framework for a new 3D/4D display/dissemination tool, but it *is* a starting point.I'm kinda thinking about a melding of Mapserver and IDV, in th elong run.Gerry • GMU SERVE-Client stuff! http://www.unidata.ucar.edu/support/help/MailArchives/galeon/msg00079.html • Exception • If a server gets a WCS request that generates a Service Exception Message, what should the HTTP response code be? 400 - "Bad Request" ?? Is this in the spec somewhere ? • that makes sense: the error is on the WCS layer, while the HTTP "transport" layer did its job.-PeterSean Forde wrote: I know that in the WMS specification, ServiceExceptions are supposed to be returned with HTTP Status Code 200 OK. I would be surprised if it were different for WCS. -Sean
Sources Datasets diverse Wrappers View-specific Virtual Data Cubes Global data model for queries Lat Lon Elev Time Flexible format for response Query Protocols Queries dataset-neutral Formats Data dependent Station-Point SQL Server, Files… DataFed SOAP,HTTP Get GeoTable SequenceImage, file OGC WCSHTTP Get, Post GML,NetCDF nDim GridOpenDAPNetCDF, … OGC WMSHTTP Get GeoImage Other Traject., Event, Pic Others? e.g. OpenDAP Other Time Slice
Query Protocols Queries dataset-neutral Sources Diverse formats Many data models Data Wrapper Data into geo-cubes Queries to views Virtual Data Cube Global geo-cube data model Makes queries data-neutral Query Adapter Maps query to protocol User selects protocols Output Protocol dependent User specified Station-Point SQL Server, Files… DataFed SOAP,HTTP Get GeoTable CSV,XLS,GML SequenceImage, file OGC WCSHTTP Get, Post GeoGrid GML,NetCDF.. nDim GridOpenDAPNetCDF, … OGC WMSHTTP Get GeoImage GeoTIFF, PNG.. Other Traject., Event, Pic Others? e.g. OpenDAP Other MS Dataset..
Time Slice Thing AgainThink Inside the Box! nDim Data Cube OGC WCS HTTP Get, Post (SOAP) Station-Point SQL Server, Files… OGC WCSHTTP Get, Post nDim GridOpenDAPNetCDF, … OGC WMSHTTP Get SequeImageCoded File Names OGC WCSHTTP Get, Post Cursor/Controller Spatial Slice
Map • Coverage=THREDDS_GFS.u&BBOX=-180,-90,180,90,1350,1350 &TIME=2005-12-06T12:00:00Z/2005-12-06T12:00:00Z/PT3H • Coverage=THREDDS_GFS.u&BBOX=-34,49.05,-34,49.05,1350,1350&TIME=2005-12-05T00:00:00Z/2005-12-08T12:00:00Z/PT3H • Coverage=THREDDS_GFS.T&BBOX=-34,49.05,-34,49.05,0,18000 &TIME=2005-12-06T12:00:00Z/2005-12-06T12:00:00Z/PT3H
CAPITA:Coverage=SURF_MET.RHBext&BBOX=-126,24,-65,52,0,0 &TIME=2002-07-07T00:00:00Z/2002-07-07T00:00:00Z/PT1H&format=NetCDF-table • CAPITA: Coverage=SEAW_US.Reflectance_350&BBOX=-126,24,-65,52,0,0 &TIME=2002-07-07T00:00:00Z/2002-07-07T00:00:00Z/P1D &format=GeoTIFF • UFlorence: COVERAGE=sst(time-lat-lon )&&BBOX=0,30 ,40,60 &TIME=2001-01-01T00:00:00Z,2001-01-01T00:00:00Z&FORMAT=netCDF
CAPITA:Coverage=SURF_MET.RHBext&BBOX=-126,24,-65,52,0,0 &TIME=2002-07-07T00:00:00Z/2002-07-07T00:00:00Z/PT1H&format=NetCDF-table • CAPITA: Coverage=SEAW_US.Reflectance_350&BBOX=-126,24,-65,52,0,0 &TIME=2002-07-07T00:00:00Z/2002-07-07T00:00:00Z/P1D &format=GeoTIFF • UFlorence: COVERAGE=sst(time-lat-lon )&&BBOX=0,30 ,40,60 &TIME=2001-01-01T00:00:00Z,2001-01-01T00:00:00Z&FORMAT=netCDF
GeoRSS - http://www.georss.org/ • W3 GeoPoint • GML
Udell Web 3.0: • Although the internet seems to touch every aspect of our lives, its network effects have yet to transform two major infrastructures: electric power and air travel. In earlier items -- The energy web and Peer-to-peer air travel -- I wrote about how we'll expose these infrastructures to the kinds of network effects that we now take for granted when we use services like craigslist and eBay. • The visions are spelled out most clearly in the EPRI (Electric Power Research Institute) roadmap, a lucid prescription for an intelligent power grid, and in James Fallows' Free Flight, which chronicles the efforts of Eclipse Aviation and others to create air taxi services that leverage thousands of regional airports like mine. • When I wrote those earlier essays in 2002 and 2004, I imagined two watershed scenarios. The first would involve networking my home appliances in order to itemize my electric bill, and to expose my electricity consumption to price-sensitive management both by me and by a management service. In the second scenario, I'd negotiate online for an air taxi that would take me and a handful of fellow travelers directly from my regional airport to its counterpart near my destination, bypassing both of the usual spokes as well as the Chicago hub. • While neither scenario is imminent, both are now more clearly discernible on the horizon. The June 2005 issue of Esther Dyson's Release 1.0 mentions two companies working to make these visions real: GridPoint and DayJet. GridPoint has two products. GridPoint Protect combines generator-based backup power for homes and businesses with demand-management software that enables (retrofitted) appliances to be scheduled for off-peak operation. GridPoint Connect uses the same demand-management technology in the same ways, but also offers intelligent management of renewable sources such as solar power. Writes Esther Dyson: • The idea is simple: to move beyond time-of-day utility pricing/consumption to something more granular, and to give users automated tools to control their usage in reaction to their own needs, to price/demand fluctuations of power supplies, and -- more novel --- demands of other users. • DayJet wants to use the same kind of peer-network negotiation to optimize air travel. The company's CEO is Ed Iacobucci, who I first met in 1989 when he came to BYTE to show us the original OS/2-based version of Citrix which he'd left IBM to create. In 2006 DayJet plans to take delivery of a fleet of Eclipse 500 jets and launch an air taxi service. The CEO of Eclipse, incidentally, is Vern Raburn, another veteran of the software industry (Microsoft, Lotus, Symantec). • In the Web 2.0 era, we're learning how to build and use software that enables us to collectively manage information resources. Those skills will serve us well in Web 3.0, when we expose other kinds of resources -- power, transportation -- to the same network effects.
Kudos to Alex Bosworth for figuring out a clever way to save bookmarks semi-privately in del.icio.us. It took me a moment to sort out how this works because it depends on a feature I didn't know del.icio.us had: the ability to tag an item for a friend. I could find no documentation on this, but eventually guessed correctly that if I want to tag this page for Stephen O'Grady, I can use the tag for:sogrady. Now it's listed at del.icio.us/for/sogrady, but only Stephen can view that page. Alex's insight was to create a del.icio.us account, private.bookmarks, along with a bookmarklet generator that produces an account-specific bookmarklet. That bookmarklet invokes a script, on his server, that runs as private.bookmarks. When I use it to bookmark this page, it adds the page to for:judell, which means I can see it at del.icio.us/for/judell but nobody else can. Except for the owner of the private.bookmarks account, which is one reason why I call this a semi-private scheme. The other is that everyone's semi-private bookmarks are pooled at del.icio.us/private.bookmarks. Like regular del.icio.us tagging, the for: mechanism is of course spammable. There's basically nothing in del.icio.us/for/judell at the moment, probably because hardly anyone has discovered the feature, but this posting is liable to change that. A reasonable fix would be to add whitelisting to the for: mechanism. I'm not bullish on email whitelisting, because there I do wish to remain wide open if I can keep the spam under control. But in this case I might be willing to enumerate who can pop links into my queue -- particularly if I can reuse that live list for other purposes. I'd also like to be able to delete things in my for: bucket. That wouldn't mean deleting the sender's bookmarklets, but rather rejecting for: tags aimed at me. I've wanted private (or at least semi-private) bookmarking for a long time. When I checked my own del.icio.us RSS feed -- del.icio.us/rss/judell -- the need became really apparent. There are currently 74 subscribers to that feed. Yikes! For their sakes I really should separate personal items from professional ones. Until spam catches up with it, or until del.icio.us adds the feature natively, I think Alex's scheme will be good enough. The larger point here is one I've been mulling a lot lately: Eric von Hippel's notion of user innovation toolkits. It's remarkable that Alex Bosworth can, by a simple act of intermediation, add a useful feature to del.icio.us. I think the qualities of web-based software that enable this scenario qualify it as an important kind of user innovation toolkit.
Environmental Virtual Observatory (for Data, not analysis) • Loose coupling to data – SOAP – WCS – DataFed • RSS/Atom for data syndication … by third party? • LocTimeParam coding of • Hard structured data (surface, satellite, model..) • Formal Literature (publications, SCI analysis) • Unstructured web data (images, ad hoc monitoring, blogs..?) • Metadata (tags for • Distributed management organic as in the web…
DataFed Access Protocols Data Views • M – Map • T – Time • E - Elev Output Type • Image • Table • Grid