Download
1 / 1
10 likes | 99 Views
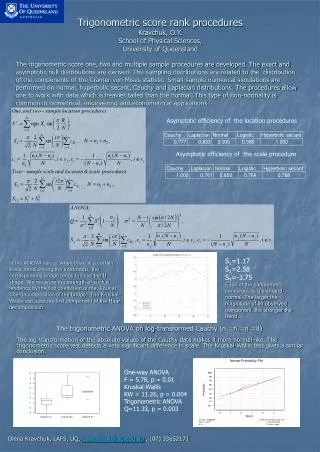
This research explores the asymptotic efficiency of trigonometric score procedures in statistics, including exact and asymptotic null distributions. Small-sample simulations on various distributions are performed. Applications and significance are discussed.

E N D
S1=1.17 S2=2.58 S3=-3.75 Each of the components converges to a standard normal. The larger the magnitude of an observed component, the stronger the trend… Trigonometric score rank proceduresKravchuk, O.Y.School of Physical Sciences,University of Queensland Asymptotic efficiency of the location procedures Asymptotic efficiency of the scale procedure The trigonometric score one, two and multiple sample procedures are developed. The exact and asymptotic null distributions are derived. The sampling distributions are related to the distribution of the components of the Cramer-von Mises statistic. Small-sample numerical simulations are performed on normal, hyperbolic secant, Cauchy and Laplacian distributions. The procedures allow one to work with data which is heavier tailed than the normal. This type of non-normality is common in biometrical, engineering and econometrical applications. In the ANOVA layout, when there is a certain linear trend among the treatments, the corresponding bridge tends to have the U-shape. We measure the strength of such a tendency by the first coefficient of the Fourier sine-decomposition of the bridge. The Kruskal-Wallis test uses the first component of the Haar decomposition. The trigonometric ANOVA on log-transformed Cauchy (n1=n2=n3=8) The log-transformation of the absolute values of the Cauchy data makes it more normal-like. The trigonometric score test detects a very significant difference in scale. The Kruskal-Wallis test gives a similar conclusion. One-way ANOVA F = 5.78, p = 0.01 Kruskal-Wallis KW = 11.26, p = 0.004 Trigonometric ANOVA Q=11.33, p = 0.003 Olena Kravchuk, LAFS, UQ, o.kravchuk@uq.edu.au , (07) 33652171