Download
1 / 109
1.09k likes | 1.2k Views
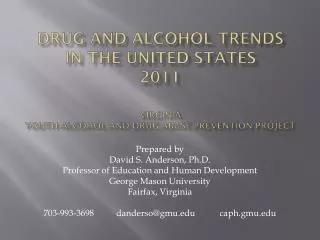
Comprehensive analysis on substance abuse trends in the U.S., focusing on alcohol and drug consumption statistics, data comparison with Europe, and youth behavior patterns. The study presents insights from various surveys and sources to track drug and alcohol usage among different age groups, highlighting implications for prevention projects and policy interventions.

E N D
Drug and Alcohol trends in the united states2011Virginia Youth alcohol and drug abuse prevention project Prepared by David S. Anderson, Ph.D. Professor of Education and Human Development George Mason University Fairfax, Virginia 703-993-3698 danderso@gmu.edu caph.gmu.edu
General Adult Population • General Usage Patterns
Alcohol-Related Fatalities National Highway Traffic Safety Administration
Alcohol-Related Traffic Fatalities, Rate per 100,000, Ages 18-20 vs. 21-24, United States, 1982-2007 U.S. MLDA Age 21 law MLDA 21 in all 50 states Data in initial NIAAA college report 30.25 (n=3,867) Ages 21-24 ↓44% 27.35 (n=4,733) 15.33 (n=2,583) 11.97 (n=1,520) Ages 18-20 ↓60% Source: U.S. Fatality Analysis Reporting System, 2009; U.S. Census Bureau, 2009
"Although statistics on drug use in the United States are not fully reliable, the numbers available indicate that US consumption of cocaine and marijuana has been essentially stable for many years—although considerably reduced from its peak in the 1970s and 1980s. The data also show that, today, the United States consumes illegal substances at a rate some three times that of Europe—although the use of drugs in the EU continues to grow rapidly and a few countries actually consume more per capita than the United States. In both the United States and Europe, the wholesale and street prices of cannabis and cocaine have declined in the past several years, although reportedly their potency has increased and demand remains steady. Across the world, illicit drugs appear to be available at stable or declining prices. A recent EU Commission study concluded that global drug production and use remained largely unchanged during the period from 1998 through 2007.“ Source: Hakim, Peter, "Rethinking US Drug Policy," Inter-American Dialogue (Washington, DC: The Beckley Foundation, February, 2010), p. 4.http://www.thedialogue.org/uploads/Documents_and_PDFs/Documents_and_PDFs...
Treatment Episode Data Set - Admissions (TEDS-A), 2008 http://www.icpsr.umich.edu/quicktables/quickoptions.do
Treatment Episode Data Set - Admissions (TEDS-A), 2008 http://www.icpsr.umich.edu/quicktables/quickoptions.do
High School and Middle School Youth • Patterns Linked to Start of Use • Use Linked to Homework Checked by Parents • Use Linked to Involvement in Activities
Alcohol is the Substance of Choice Among Adolescents Source: Monitoring the Future
(12-17) (26 and older) Youth drink less frequently than adults, but drink more per occasion Source: SAMHSA National Survey on Drug Use and Health, 2002
A number of information sources are used to quantify America’s drug problem and to monitor drug abuse trends. Foremost among these sources are the Monitoring the Future (MTF) survey* and the National Survey on Drug Use and Health** (NSDUH). Since 1975, the MTF survey has measured drug, alcohol, and cigarette use as well as related attitudes among adolescent students nationwide. For the 2010 survey, 46,482 students in 8th, 10th, and 12th grades from 396 public and private schools participated. Funded by NIDA, the MTF survey is conducted by investigators at the University of Michigan. The NSDUH is an annual survey on the nationwide prevalence and incidence of illicit drug, alcohol, and tobacco use, abuse, and dependence among Americans aged 12 years and older, conducted by the Substance Abuse and Mental Health Services Administration. Approximately 67,500 people are included in this survey. Because of differences in the timing of administration of the surveys, reported NSDUH data are 1 year behind those of MTF. In MTF and NSDUH, there are three primary prevalence periods for which data are reported: lifetime, past year, and past month (also referred to as “current”). It is generally believed that past year and past month are the better indicators of actual use. However, some analyses are done for only one specific prevalence period. http://www.nida.nih.gov/infofacts/nationtrends.html
High School and Middle School Youth:30 Day Alcohol Use http://monitoringthefuture.org/data/10data.html#2010data-drugs
High School and Middle School Youth: Drunk in Last 30 Days http://monitoringthefuture.org/data/10data.html#2010data-drugs
High School and Middle School Youth:5 or more drinks in a row in last 2 weeks http://monitoringthefuture.org/data/10data.html#2010data-drugs
High School and Middle School Youth: 30 Day Tobacco Use http://monitoringthefuture.org/data/10data.html#2010data-drugs
High School and Middle School Youth:Any illicit drug in last 30 days http://monitoringthefuture.org/data/10data.html#2010data-drugs
High School and Middle School Youth:Any illicit drug other than marijuana in last 30 days http://monitoringthefuture.org/data/10data.html#2010data-drugs
High School and Middle School Youth: 30 Day Marijuana Use http://monitoringthefuture.org/data/10data.html#2010data-drugs
High School and Middle School Youth: 30 Day Ecstasy Use http://monitoringthefuture.org/data/10data.html#2010data-drugs
High School and Middle School Youth: 30 Day Narcotics Use http://monitoringthefuture.org/data/10data.html#2010data-drugs
High School and Middle School Youth: 30 Day Cocaine Use http://monitoringthefuture.org/data/10data.html#2010data-drugs
High School and Middle School Youth: 30 Day Inhalant Use http://monitoringthefuture.org/data/10data.html#2010data-drugs
High School and Middle School Youth: 30 Day LSD Use http://monitoringthefuture.org/data/10data.html#2010data-drugs
High School and Middle School Youth: 30 Day Amphetamine Use http://monitoringthefuture.org/data/10data.html#2010data-drugs
National Survey on Drug Use and Health, 2009 http://www.icpsr.umich.edu/icpsrweb/SAMHDA/
National Survey on Drug Use and Health, 2009 http://www.icpsr.umich.edu/icpsrweb/SAMHDA/
National Survey on Drug Use and Health, 2009 http://www.icpsr.umich.edu/icpsrweb/SAMHDA/
National Survey on Drug Use and Health, 2009 http://www.icpsr.umich.edu/icpsrweb/SAMHDA/
National Survey on Drug Use and Health, 2009 http://www.icpsr.umich.edu/icpsrweb/SAMHDA/
National Survey on Drug Use and Health, 2009 http://www.icpsr.umich.edu/icpsrweb/SAMHDA/
National Survey on Drug Use and Health, 2009 http://www.icpsr.umich.edu/icpsrweb/SAMHDA/
National Survey on Drug Use and Health, 2009 http://www.icpsr.umich.edu/icpsrweb/SAMHDA/
National Survey on Drug Use and Health, 2009 http://www.icpsr.umich.edu/icpsrweb/SAMHDA/
National Survey on Drug Use and Health, 2009 http://www.icpsr.umich.edu/icpsrweb/SAMHDA/
National Survey on Drug Use and Health, 2009 http://www.icpsr.umich.edu/icpsrweb/SAMHDA/
According to NSDUH, overall prevalence of underage (ages 12–20) alcohol use and binge drinking has shown a gradual decline across all prevalence periods. In 2009, an estimated 30.2 million people (12.0 percent) aged 12 or older reported driving under the influence of alcohol at least once in the past year. Although this reflects a downward trend from 14.2 percent in 2002, it remains a cause for concern. The decline in illicit drug use by the Nation’s adolescents since the mid- to late-1990s has leveled off. Among 8th, 10th, and 12th graders, most measures of illicit drug use remained unchanged from 2009 to 2010. Marijuana use rose this year—a sharp contrast to the considerable decline of the preceding decade. The downward trend in ecstasy use has been reversed as well, with significant increases this year following a considerable and recent decline in the belief that its use is dangerous. http://www.nida.nih.gov/infofacts/nationtrends.html
Prescription and over-the-counter (OTC) medications accounted for most of the top drugs abused by 12th graders in the past year. Among 12th graders, past-year nonmedical use of Vicodin decreased from 9.7 percent to 8.0 percent. However, past-year nonmedical use of Oxycontin remained unchanged across the three grades and has increased among 10th graders over the past 5 years. Moreover, past-year nonmedical use of Adderall and OTC cough and cold medicines among 12th graders remained high at 6.5 percent and 6.6 percent, respectively. Complete NSDUH findings are available at www.oas.samhsa.gov/NSDUHLatest.htm.
The Partnership at Drugfree.org http://www.drugfree.org/newsroom/new-research-teen-drug-and-alcohol-use-headed-in-wrong-direction
Underage Drinking in Europe Austria Belgium Bulgaria Croatia Cyprus Czech Republic Denmark Estonia Farce Islands Finland France Germany Greece Greenland Hungary Iceland Ireland Isle of Man Italy Latvia Lithuania Malta Netherlands Norway Poland Portugal Romania Russia Slovak Republic Slovenia Sweden Switzerland Turkey Ukraine UK USA Austria Belgium Bulgaria Croatia Cyprus Czech Republic Denmark Estonia Farce Islands Finland France Germany Greece Greenland Hungary Iceland Ireland Isle of Man Italy Latvia Lithuania Malta Netherlands Norway Poland Portugal Romania Russia Slovak Republic Slovenia Sweden Switzerland Turkey Ukraine UK Spain USA 0 10 20 30 40 0 10 20 30 40 50 60 70 80 90 100 ESPAD 2003 50 60 70 80 90 100 Percent of 15-Year Olds Who Drank to Intoxication in the Past 12 Months Percent of 15-Year Olds Who Consumed an Alcoholic Beverage in the Past 12 Months
College Youth • General Usage Patterns • Student-Athletes
TRADITIONAL-AGE COLLEGE STUDENTS: ALCOHOL USE IN LAST 30 DAYS http://monitoringthefuture.org/pubs/monographs/vol2_2009.pdf
TRADITIONAL-AGE COLLEGE STUDENTS: DRUNK IN LAST 30 DAYS http://monitoringthefuture.org/data/10data.html#2010data-drugs
USE OF ALCOHOL BY TRADITIONAL-AGE COLLEGE STUDENTS: 5+ Drinks at a Setting in the Last Two Weeks http://monitoringthefuture.org/pubs/monographs/vol2_2009.pdf
TRADITIONAL-AGE COLLEGE STUDENTS: 30 DAY USE OF MARIJUANA http://monitoringthefuture.org/pubs/monographs/vol2_2009.pdf
TRADITIONAL-AGE COLLEGE STUDENTS: 30 DAY USE OF ECSTASY http://monitoringthefuture.org/pubs/monographs/vol2_2009.pdf
TRADITIONAL-AGE COLLEGE STUDENTS: 30 DAY USE OF NARCOTICS OTHER THAN HEROIN http://monitoringthefuture.org/pubs/monographs/vol2_2009.pdf