Download
1 / 1
10 likes | 171 Views
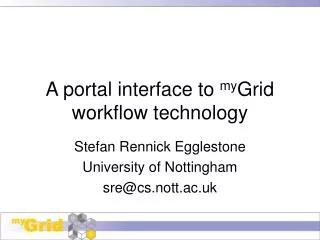
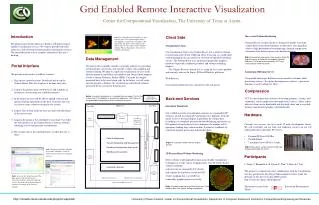
Below: Our portal architecture is a standard three tier model. The first tier is client side. The middle tier is primarily the webserver. The third tier is the grid enabled computational and visualization resources. Grid Enabled Computational and Visualization Resources. Hardware

E N D
Below: Our portal architecture is a standard three tier model. The first tier is client side. The middle tier is primarily the webserver. The third tier is the grid enabled computational and visualization resources. Grid Enabled Computational and Visualization Resources • Hardware • Currently our services run on a small 12 node development cluster. We will eventually run our back end rendering services on our 130 node production commodity PC cluster: • Pentium III Xeon 800 Mhz • 256 Mb RAM • 7 machines have GeForce 4 cards. Middle Tier Back End Client Side Web Browser Database • Portal Accounts Repository • Session Schedule Information Authentication MyProxy Server Python COG • Portal Authentication • Session Scheduling and Management • Rendering Configuration and Launch • Web Based Visualization Right: Rear view of a single row of the 130 node Compaq commodity PC cluster. Thick Visualization Client Participants C. Bajaj, S. Khandelwal, B. Kwon, R. Park, Y. Shin, & J. Sun. This project is conducted in close collaboration with the Visualization Services group at the San Diego Supercomputer Center, under the direction of Dr. Steve Cutchin. SDSC portal: http://visservices.npaci.edu/gridportal/. This project is part of the Interaction Environments Thrust. Data • Information Services Data Management ( SRB ) Send: Viewing Parameters Receive: Geometry and Images Authenticated CORBA Connection Grid Enabled Remote Interactive Visualization Center for Computational Visualization, The University of Texas at Austin. Introduction The primary goal of this effort is to build a web-portal to grid-enabled visualization services. We want to provide both fully interactive and web-based remote parallel visualization services. We intend the portal to be a seamless extension of the user’s desktop. Ray-casted Volume Rendering Our parallel ray-casting scheme is designed to handle very large volume data on distributed memory architectures. Our algorithm achieves high performance by minimizing, through compression, communication between processors during rendering. Client Side Visualization Client Our visualization client is the Volume Rover. It is a multi-resolution isocontouring and volume rendering client. It can run as a stand alone rendering program or can connect to our back-end parallel rendering servers. The Volume Rover uses modern programmable graphics hardware to provide combined geometry and volume rendering displays. The Volume Rover is written in C++ using Qt. It is easily portable and currently runs on the Linux, SGI and Windows platforms. Web Browser. Any normal modern browser can interact with our portal. Left: The Volume Rover. The interface is split into two panes. The right hand pane shows a sub-sampled version of the entire dataset. The pane on the left shows a full resolution sub-volume from the data. Data courtesy Michael Norman (Physics Department, University of California San Diego). Data Management The portal will eventually include a total data solution, by providing automated data conversion, data transfer, volume sub-sampling and volume filtering. We plan to couple our visualization services to the data management capabilities provided by San Diego Supercomputer Center’s Storage Resource Broker (SRB). Currently the images generated have to be saved client-side. In the future, we will cache and catalog into a database the visualizations and filtered volumes generated by the system for frequent users. Right: Human brain cryosection. Data courtesy Arthur W. Toga (University of California Los Angeles School of Medicine). The image was produced by CCV’s ray-casting volume rendering server. • Portal Interface • We present an interactive workflow scenario. • Sign up for a portal account. Download and set up the Volume Rover. This first step has to be done only once. • Login to the portal using a web browser and schedule an interactive session using our scheduler interface. • In the future the user will be able to upload a dataset and specify filtering operations on the data. Currently, the user can choose from a dataset existing on the system. • Logout. The system sends the user an email with the details of the next session. • Login to the portal at the scheduled session time. Use either the web interface or the Volume Rover to interact with the rendering servers and generate visualizations. • 6. The session ends at the scheduled time, or when the user is done. Anisotropic Diffusion Server Our parallel anisotropic diffusion server smoothes volumes while preserving surfaces. To capture heterogeneous surfaces, a piecewise function is used to obtain the filter. Compression CCV has developed and continues to develop geometry, volume, and volumetric video compression-decompression (codecs). These codecs alleviate client-server bandwidth and also both client and server disk-memory and memory-graphics card bandwidth. Back-end Services Isocontour Rendering Our scalable isosurface visualization solution on a commodity PC cluster is an end-to-end parallel and progressive platform, from the initial access to the final display. It partitions the volume data according to is workload spectrum for load balancing and creates an I/O optimal external interval tree to minimize the number of I/O operations loading large data from disk. It achieves scalability by using both parallel processing and parallel disks. Right: An isocontour render from the Engine dataset. Left: The portal’s scheduler interface. A user must schedule a session in order to use the interactive rendering services. 3D Texture Based Volume Rendering Direct volume rendering had become an invaluable visualization technique for a wide variety of applications. Our 3D texture based volume rendering software runs on commodity PC clusters and exploits the hardware accelerated 3D texture mapping that is available on commodity graphics processors today. Right: A screen shot from the portal. The page shown is for theweb-based interaction with the isocontour renderingservice. The results from the rendering are returned as an image in the browser window. Right: A volume rendering of the Rice Dwarf virus. Data courtesy Wah Chiu (Baylor College of Medicine). http://ccvweb.csres.utexas.edu/projects/visportal/ University of Texas at Austin, Center for Computational Visualization, Department of Computer Sciences & Institute for Computational Engineering and Sciences.