Download
1 / 6
60 likes | 92 Views
Gold markets should continue to be very noisy, as we had initially rally during Friday<br>but then Saul sellers get back into the marketplace. I think the $1300 level<br>underneath continues to be support, and I think that we will eventually find that an<br>area that attracts enough attention to have buyers return. However, if we were to<br>break down below the $1300 level, I think that the market will probably go looking<br>towards the $1275 level. We have been in an uptrend for some time.

E N D
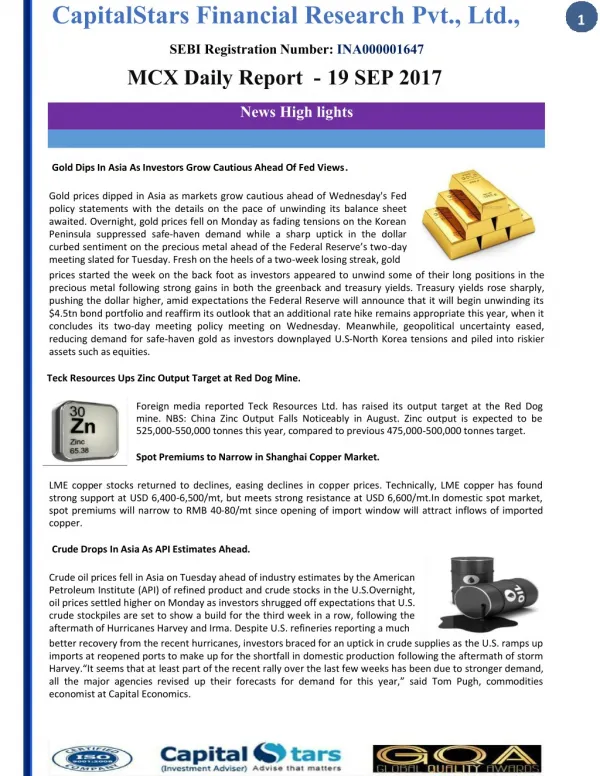
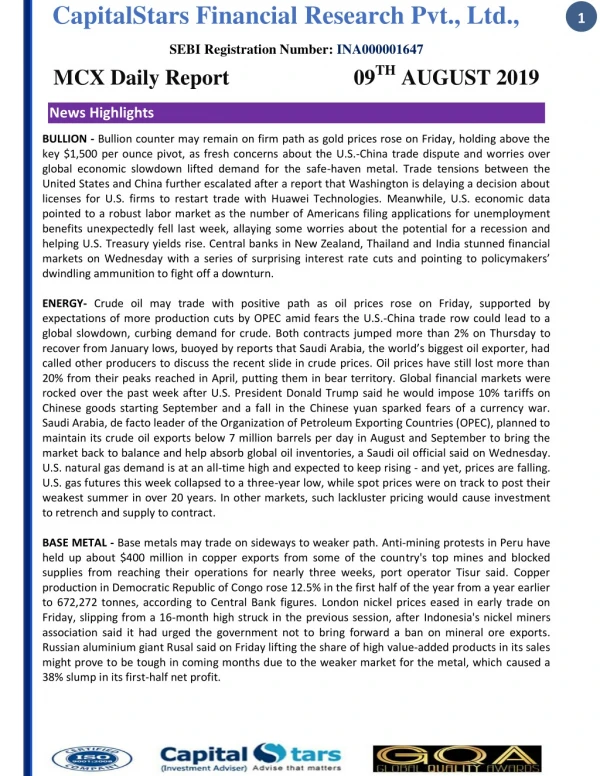
19/03/2018 MONDAY GOLDFUNDAMENTAL/TECHNICALUPDATE The gold markets rallied a bit initially during the trading session on Friday, but then broke down significantly. Since then, we have bounced from the $1310 level, but started to show signs of weakness again. Gold markets should continue to be very noisy, as we had initially rally during Friday but then Saul sellers get back into the marketplace. I think the $1300 level underneath continues to be support, and I think that we will eventually find that an area that attracts enough attention to have buyers return. However, if we were to break down below the $1300 level, I think that the market will probably go looking towards the $1275 level. We have been in an uptrend for some time, although it’s
19/03/2018 MONDAY been very noisy. I recognize that there has been a bit of a “risk off” trade as of late, and that of course has been hurting the gold markets. With the rising US dollar, that typically will work against the value of gold, but it doesn’t have to.I think that ultimately, we will find buyers, so I’m waiting for some type of bounce, or perhaps even a hammer on the daily chart to start buying. I think that the market then goes looking towards the $1350 level, and then eventually the $1400 level above. Once we clear that level, then gold is free to become more of a “buy-and-hold” market place. Until then, expect a lot of choppiness but I look at these pullbacks as buying opportunities. There are far too many moving pieces out there to think that there won’t be some type of headlines across the wire soon that will put traders into the gold markets.. Forecast Gold is trading steady early Wednesday in reaction to a weaker U.S. Dollar following the surprise firing of U.S. Secretary of State Rex Tillerson and the release of a benign U.S. consumer inflation report. At 0655 GMT, April Comex Gold is trading $1326.30, down $0.80 or -0.06%. The surprise dismissal of Tillerson has brought up the topic of protectionism again and this may be underpinning the gold market. Additionally, there are reports that President Trump is planning to implement hefty tariffs on Chinese imports. Trump may be seeking to impose tariffs of up to $60 billion of Chinese imports and will target the technology and telecommunications sectors, two people who had discussed the issue with the Trump administration said on Tuesday. The tariffs on China are widely opposed by a vast majority of economists as they are expected to do more harm than good. This is pressuring the dollar and supporting gold. This is probably what will be driving the price action the rest of the week. Later today, investors will also get the opportunity to react to a number of U.S. economic reports on Retail Sales, Producer Inflation and Business Inventories. A drop in retail sales and producer inflation will be bullish for gold because they will add further to the notion of gradual rate hikes by the Fed this year. COPPERFUNDAMENTAL/TECHNICALUPDATE
19/03/2018 MONDAY Based on last week’s close at $3.1360 and the price action, the direction of the copper market this week is likely to be determined by trader reaction to the main 50% level at $3.1460. Copper prices fell last week before rallying enough late in the week to settle slightly better. The volatile two-sided price action was fueled by the movement in the U.S. Dollar and uncertainty over President Trump’s tariffs on steel and aluminum. Weekly Technical Analysis The main trend is up according to the weekly swing chart. However, momentum has been trending lower since the top at $3.335 the week-ending December 29. A trade through the main bottom at $3.0465 will signal a resumption of the downtrend. If this move generates enough downside momentum, we could see an eventual test of the next main bottom at $2.9585. The main range is $2.9585 to $3.3335. Its retracement zone is $3.1460 to $3.1020. The market has straddled this zone four out of five weeks. This zone is controlling the longer-term direction of the market. The short-term range is $3.0465 to $3.2905. Its 50% level or pivot at $3.1685 provided resistance last week.
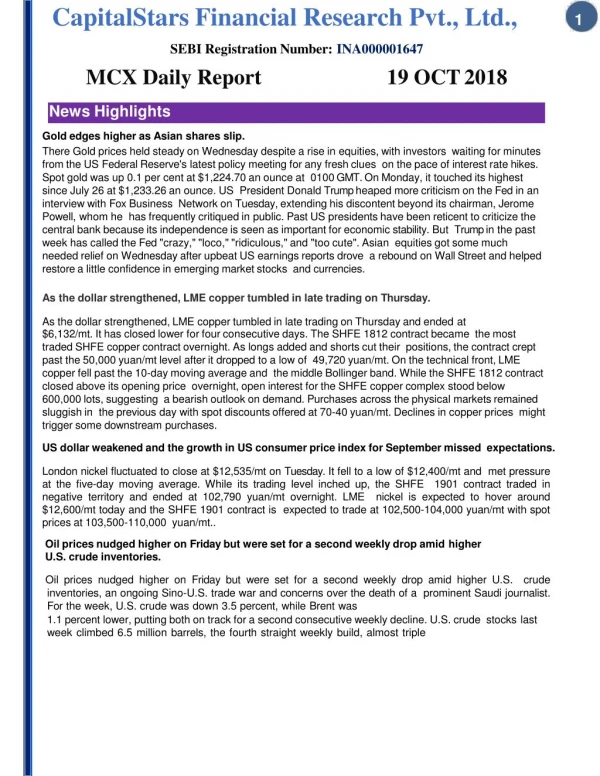
19/03/2018 MONDAY Weekly Technical Forecast Based on last week’s close at $3.1360 and the price action, the direction of the copper market this week is likely to be determined by trader reaction to the main 50% level at $3.1460. A sustained move under $3.1460 will indicate the presence of sellers. This could lead to a test of the main Fibonacci level at $3.1020. Last week, sellers took out this level, but quickly regained it into the close. If the selling pressure increases this week then we could see a move into $3.0465. Look for a possible acceleration to the downside if $3.0465 fails as support. This could drive the market into $2.9585. A sustained move over $3.1460 will signal the presence of buyers. This could drive the market into $3.1685. This price is a possible trigger point for acceleration to the upside. The direction of the dollar this week is likely to have a big influence on copper prices. The price action in the dollar will likely be dictated by the results of the U.S. consumer inflation report. CRUDEFUNDAMENTAL/TECHNICALUPDATE Oil markets went sideways during the session initially on Friday, but then exploded to the upside, reaching towards the initial resistance. We have been hugging a trend
19/03/2018 MONDAY line in the WTI grade, which is going to be a significant signal for crude oil in general. WTI Crude Oil The WTI Crude Oil market initially went sideways during trading on Friday, but then rallied to break above the $61.50 level. We reached towards the $62.25 level, an area that is minor resistance. I think that if we pull back, it will more than likely attract buyers unless we break down below the uptrend line, and more importantly: the $60 handle. If we were to break down below there, the uptrend is over, and I would become massively short of this pair. Otherwise, if we break above the $63 level, the market should then go to the $64 level, which being broken to the upside would be very bullish as well. Brent Brent markets went sideways initially during the trading session on Friday as well, using the $65 level as support. This very important psychological level has brought in buyers, and as I record this we have gained over one dollar, as we are testing the $66 handle above. By breaking above this level, we will then test the $66.50 level, the market should continue to go much higher. However, the bread market is a bit different than the WTI market, as we have already broken below the uptrend line. So, the question now would be whether we can get some help from the WTI market to push Brent higher as well. If we were to break down below the $64 level, that should have this market on winding rather drastically. Expect volatility regardless. INTERNATIONALRATESOFCOMMODITIES
19/03/2018 MONDAY DISCLAMIER Trading/investing in Stock Market involves considerable risk; you may lose part or all of the initial investment. It is not ideal for all types of investors. Past performance may not necessarily be repeated in the future. The views & tips provided is based on information & analysis which is believed to be accurate. This information is provided to enable you to make your own investment decisions and should not be construed as investment advice. Rudra Investment does not offer any product/service with assured/guaranteed returns. The anticipatory moves mentioned are purely subject to technical studies and does not take into consideration sudden currency volatility and data events. The author, directors and/or employees of Rudra Investment cannot be held responsible for the accuracy of the tips. For more information and terms & condition kindly visit our website. All information offered at Rudra Investment. is copyright protected and copying or redistribution of information, reports and news is strictly prohibited. Our visitors do acknowledge that warranty that is offered in connection with services and products described herein is offered completely by the advertiser or supplier of that product and not by Rudra Investment. We do not warrant that access to our site and relevant services would be error free or uninterrupted that defects gets corrected. We are not accountable for viruses, irregularities, damage to the computers that result from availing, accessing or downloading any information from our website. For More Info Visit Here:- http://rudrainvestment.com/