Download
1 / 10
0 likes | 26 Views
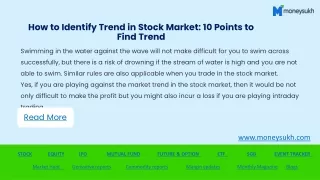
Swimming in the water against the wave will not make difficult for you to swim across successfully, but there is a risk of drowning if the stream of water is high and you are not able to swim. Similar rules are also applicable when you trade in the stock market.

E N D
Swimming in the water against the wave will not make difficult for you to swim across successfully, but there is a risk of drowning if the stream of water is high and you are not able to swim. Similar rules are also applicable when you trade in the stock market.Yes, if you are playing against the market trend in the stock market, then it would be not only difficult to make the profit but you might also incur a loss if you are playing intraday trading. Read More How to Identify Trend in Stock Market: 10 Points to Find Trend www.moneysukh.com STOCKEQUITYIPOMUTUAL FUNDFUTURE & OPTION ETF SGB Event tracker Market HuntDerivative reportsCommodity reportsMargin updatesMonthly Magazine Blogs
Understanding the Trend in the Market A trend in the stock market means the direction of the market index or individual stocks heading towards a particular direction. The stock markets usually do not move in a straight line direction and can be volatile for a day a few trading sessions or for a few days. And amid such zigzags, you need to find out the market trend, whether it heading towards or in which direction. And to understand the trend you need to perform the trend analysis that will help to find out the trend. Trend analysis is the process of analyzing the market movement using chart patterns like candlesticks chart patterns and trend lines. Read More www.moneysukh.com STOCKEQUITYIPOMUTUAL FUNDFUTURE & OPTION ETF SGB Event tracker Market HuntDerivative reportsCommodity reportsMargin updatesMonthly Magazine Blogs
Types of Trend in the Stock Market Usually, there are three types of trends in the market – upwards, downwards and sideways or range-bound trend. Let’s know more about these trends. Upward Trend: When the price of a stock or market index keeps moving in the upward direction or keeps rising then it is called an upward trend or bullish market. Though, the index can come down during the trading session but moves with higher highs and higher lows and when seen on long days or many trading sessions it will be evident as an upward trend. Read More www.moneysukh.com STOCK EQUITYIPOMUTUAL FUNDFUTURE & OPTION ETF SGB Event tracker Market HuntDerivative reportsCommodity reportsMargin updatesMonthly Magazine Blogs
Downward Trend: The downtrend is identifiable when the value or price of the stock is falling with lower lows creating the opportunity for the traders to create the short position. And when most of the stocks every day are falling instead of going up or you can say the advance-decline ratio is declining consistently means the market is in a downtrend direction. Sideways or Range bound Trend: When the stock or index moves neither upwards nor downwards with low volatility in the market, then it is called a sideways trend. In a sideways trend, the stock trade in the range and the general accumulations and distributions takes place during most of the trading session which is also because of low volume. And when the demand and supply forces work equally then this kind of trading range is visible in the market. Read More www.moneysukh.com STOCK EQUITYIPOMUTUAL FUNDFUTURE & OPTION ETF SGB Event tracker Market HuntDerivative reportsCommodity reportsMargin updatesMonthly Magazine Blogs
How to Find Trends in the Stock Market? Identifying these trends is very important to trade with the right trading strategy. If you do not trade according to the trend of the market or individual stocks, you can incur a loss or might not get the returns as per the expectations. And to identify the trend in the stock market or individual stocks you can use various tools, techniques and technical indicators. However, the purpose of identifying the trend should be defined as per your investment time horizon. The trends are categories on the basis of these time horizons and while finding the trend in the market, you have to keep in mind these points. Read More www.moneysukh.com STOCKEQUITYIPOMUTUAL FUNDFUTURE & OPTION ETF SGB Event tracker Market HuntDerivative reportsCommodity reportsMargin updatesMonthly Magazine Blogs
Top 5Indications to Know the Trend • Drawing the Trend Line - This is one of the simplest and easiest ways to know the trend in the market or stocks. You can see if the price of the stock market index is drawn on the line chart. If you are checking the price on the candlestick chart you can draw the trend line on the chart that will tell you where the market is heading in the downwards direction or the upwards. • Candlestick Charts Patterns - The best way to find the trend in the stock market or any individual stock is to see the patterns of the candlestick charts. If you can see the green candles making the formation with higher highs on every trading session for many few days, weeks, or months. This kind of candlestick chart pattern clearly shows there is a bullish trend in the market. Read More www.moneysukh.com STOCKEQUITYIPOMUTUAL FUNDFUTURE & OPTION ETF SGB Event tracker Market HuntDerivative reportsCommodity reportsMargin updatesMonthly Magazine Blogs
Drawing the Trend Line - This is one of the simplest and easiest ways to know the trend in the market or stocks. You can see if the price of the stock market index is drawn on the line chart. If you are checking the price on the candlestick chart you can draw the trend line on the chart that will tell you where the market is heading in the downwards direction or the upwards. • Candlestick Charts Patterns - The best way to find the trend in the stock market or any individual stock is to see the patterns of the candlestick charts. If you can see the green candles making the formation with higher highs on every trading session for many few days, weeks, or months. This kind of candlestick chart pattern clearly shows there is a bullish trend in the market. Read More www.moneysukh.com STOCKEQUITYIPOMUTUAL FUNDFUTURE & OPTION ETF SGB Event tracker Market HuntDerivative reportsCommodity reportsMargin updatesMonthly Magazine Blogs
Average Daily Volume - Volume individually cannot give you the right indication to decide about the market trend. But when you see the stock price of the market index is consistently moving in the upward direction with high volume means the market is in a bullish trend. • Use the RSI Indicator - This is one of the best tools or you can say the technical indicator to identify the trend in the market. RSI or Relative Strength Index helps to identify the momentum in the stock with the signal to know whether the stock or market is in the overbought or oversold zone. Read More www.moneysukh.com STOCKEQUITYIPOMUTUAL FUNDFUTURE & OPTION ETF SGB Event tracker Market HuntDerivative reportsCommodity reportsMargin updatesMonthly Magazine Blogs
Contact us: 96382-37000 Mansukh Securities and Finance Limited: SEBI Registration Number-INZ000164537 ( Members-NSE,BSE,MCX, ),IN-DP-72-2015 ( DP-NSDL, CDSL ) Mansukh Stock Brokers Limited : SEBI Registration Number- INZ000164937 ( Members -BSE ), IN-DP-36-2015 Mansukh Commodity Futures Private Limited : SEBI Registration Number-INZ000063032 ( Members- NCDEX ) Mansukh IFSC Broking Private Limited : SEBI Registration Number- INZ000099432 (Members- NSE IFSC, INDIA INX)Procedure to file a complaint on SEBI SCORES: Register on SCORES portal. Mandatory details for filing complaints on SCORES: Name, PAN, Address, Mobile Number, E-mail ID. Benefits: Effective Communication, Speedy redressal of the grievances Investments in securities market are subject to market risks; read all the related documents carefully before investing. Thank You www.moneysukh.com STOCKEQUITYIPOMUTUAL FUNDFUTURE & OPTION
RelatedResources What Is Short Covering In Stock Market & How To Identify Rally? Importance Of Volume In Technical Analysis: Use & Role In Trading What Is Short Selling & How Does It Work: Is It Good Or Bad? Trading or Investing Which is Better and More Profitable? Best Algo Trading Platform and Trading Strategies Best Intraday Algo Strategy USD INR Options Trading Strategies How to Read, Analyse & Use Candlestick Chart STOCK EQUITYIPOMUTUAL FUNDFUTURE & OPTION ETF SGB Event tracker Market HuntDerivative reportsCommodity reportsMargin updatesMonthly Magazine Blogs