Exploring Data Organization Methods with Visual Displays
Learn about data tables, bar graphs, line graphs, circle graphs, and diagrams for organizing and presenting data effectively in various formats. Discover how to interpret and analyze data visually.

Exploring Data Organization Methods with Visual Displays
E N D
Presentation Transcript
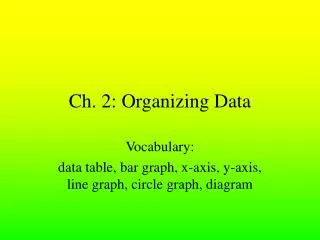
Ch. 2: Organizing Data Vocabulary: data table, bar graph, x-axis, y-axis, line graph, circle graph, diagram
Gathering and Recording Data • Now that you have gathered some data in an experiment, you need to do something with it. • These slides will show you some options that you have for organizing your data.
Data Tables • Data tables are charts that show information in rows and columns. Plants Grown in My Garden
Bar Graphs • Bar graphs show data as bars of different lengths. • Some people say that reading a bar graph is easier than seeing the information on a table. • Bar Graphs have a bunch of different parts: the x-axis, the y-axis, the scale, and the labels.
Line Graphs • Line Graphs have all the same parts that bar graphs have, except that it shows how data changes over time.
Circle Graphs • A Circle Graphs tells how much space out of 100% a certain piece of data takes up. Amount of Oxygen in the Atmosphere
Diagrams • Diagrams are drawings that show the parts of something. • Usually there will be a caption and labels to explain what the picture is.
Questions about Chapter 2 • What kind of display do you use to show changes over time? • How many cabbages were grown on the bar graph? • What is a circle graph used for? • What are captions? • Why do all displays need labels?