Download
1 / 1
10 likes | 109 Views
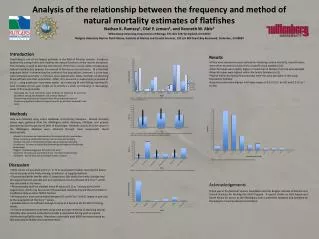
Discover the impact of natural mortality on flatfish populations and the challenges in accurately estimating this crucial parameter. This study examines various methods used to determine natural mortality rates, highlighting differences among fish families and genders. The findings shed light on the need for improved assessments to ensure sustainable fishing practices.

E N D
Introduction Results Overfishing is one of the largest problems in the field of fisheries science. It reduces biodiversity among fishes and modifies the natural functions of the marine ecosystem. Fish mortality is used to describe the removal of fish from a stock, while instantaneous natural mortality (M), denotes the removal of fish due to natural causes. M is the most important factor in determining the survival of fish populations, however; it is the least well-estimated parameter in fisheries stock assessments. Many methods of obtaining M are difficult and often impractical. Often, M is assumed in assessments as a value of 0.2 yr-1, using predictions from other stocks. By combining M with fishing mortality (F), total mortality (Z) can give insight as to whether a stock is increasing or decreasing. Goals of this study include: • Of the most commonly used methods for obtaining natural mortality, most M values were either assumed (n=24) or fit to a specific stock model (n=21). • Mean M values were slightly higher in males than in females from the assessed data. • Mean M values were highest within the family Soleidae (n=12). • Flatfish within the family Pleuronectidae were the most abundant in this study, followed by Soleidae. • Frequency rates were highest in M value ranges of 0.1-0.2 yr-1 (n=32) and 0.2-0.3 yr-1 (n=29). Analysis of the relationship between the frequency and method of natural mortality estimates of flatfishes Number of M values • Reviewing the most commonly used methods of obtaining M and their abundance among two databases and primary literature • Determining relationships between mean M among family and sex • Discovering parallels between frequency and M for all stocks assessed in the study Method Figure 1. Histogram of methods used to acquire natural mortality values for RAMlegacy (srDB), FishBase (Fbase), and primary literature (P. Lit.). Methods Mean M Data was collected using online databases and primary literature. Natural mortality values were gathered from the RAMlegacy online database, FishBase, and primary literature found through the ISI Web of Knowledge. Methods used to find the values in the RAMlegacy database were obtained through stock assessments found electronically. Frequency Sex Figure 2. Histogram of mean natural mortality by sex (n=82). Unsexed values relate to fishes assessed in both sexes and unsorted. Error bars represented are of standard deviations. • Model Fit: Estimates are fixed based on fluctuations of other parameters. • Pauly: Assumes a relationship between size and natural mortality. • Hoenig: Assumes a relationship between age and natural mortality. • Gunderson: Assumes a relationship between gonad weight and individual body weight. • Tagged: Individual tagging of fish within the stock. • Assumed: M values are assumed at 0.2 yr-1 to match related stocks. • Unknown: Source data was unavailable and/or unstated. Nathan K. Ramsey1, Olaf P. Jensen2, and Kenneth W. Able2 1Wittenberg University, Department of Biology, P.O. Box 720, Springfield, OH 45501 2Rutgers University Marine Field Station, Institute of Marine and Coastal Sciences, 132 c/o 800 Great Bay Boulevard, Tuckerton, NJ 08087 Mean M Natural mortality rate (M) Figure 5. Frequencies of natural mortality rates split into ranges of 0.1 (n=87). Discussion Family • Most values are assumed at 0.2 yr-1 or fit to assessment models, meaning the data is not as accurate as the Pauly, Hoenig, Gunderson, or tagging methods. • Discounting flatfish families with <2 data points, fish within the family Soleidae had the largest mean M, possibly due to a reported erroneous M value of 0.75 yr-1, which was calculated in the mean. • Pleuronectidae hold the smallest mean M value at 0.11 yr-1 and account for the largest stock, which may be a result of biased data collection toward Pleuronectidae or insufficient data on other flatfish families. • M frequency is most concentrated between 0.1 and 0.3 yr-1 (n=61), largely in part due to the assumption of the 0.2 yr-1 values. • Avaiable data is not sufficient enough to serve as a baseline for the MSY of fishing efforts. • In future assessments, estimates using more accurate methods of obtaining natural mortality rates must be instituted to predict a reasonable fishing yield to prevent overharvesting flatfish stocks. Maximum sustainable yield (MSY) estimates based on this data may be fallible and underestimated. Figure 3. Histogram of mean natural mortality by family (n=87). Error bars represented are of standard deviations. Acknowledgements Number of assessments Thank you to the National Science Foundation and the Rutgers Institute of Marine and Coastal Sciences for funding the RIOS Program. A special thanks to Olaf Jensen and Daniel Ricard for access to the RAMlegacy stock assessment database and everyone at the Rutgers University Marine Field Station. Family Figure 4. Histogram of assessments per family (n=72). http://welshangler.co.uk