Download
1 / 1
10 likes | 109 Views
A signal in the energy due to planetary wave reflection in the upper stratosphere. J. M. Castanheira (1), M. Liberato(2), C. DaCamara(3) and J. M. P. Silvestre(1) – Department of Physics, University of Aveiro, 3810-193 Aveiro, Portugal

E N D
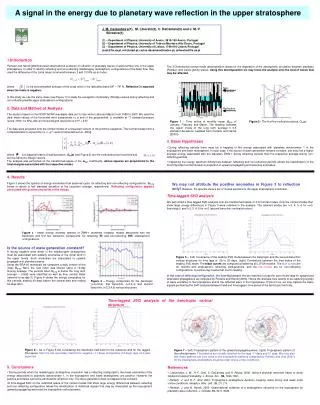
A signal in the energy due to planetary wave reflection in the upper stratosphere • J. M. Castanheira(1), M. Liberato(2), C. DaCamara(3) and J. M. P. Silvestre(1) • – Department of Physics, University of Aveiro, 3810-193 Aveiro, Portugal • – Department of Physics, University of Trás-os-Montes e Alto Douro, Portugal • (3) – Department of Physics, University of Lisbon, 1749-016 Lisbon, Portugal • jcast@fis.ua.pt, mlr@utad.pt, carlos.dacamara@meteo.pt, jsilvestre@fis.ua.pt • Introduction • Perlwitz and Harnik [2003] showed observational evidence of reflection of planetary waves of wavenumber one in the upper stratosphere. In order to identify reflecting and non-reflecting middle/upper stratospheric configurations of the basic flow,they used the difference of the zonal mean zonal wind between 2 and 10 hPa as an index : • where is the area-weighted average of the zonal wind in the latitudinal band 58o – 74o N. Reflection is expected when the index is negative. • In this study we use the same index (see Figure 1) to study the energetics of planetary (Rossby) waves during reflecting and non-reflecting middle/upper stratospheric configurations. The 3-Dimensional normal mode decomposition allows for the separation of the atmospheric circulation between planetary (Rossby) and inertio-gravity waves. Using this decomposition we may focus the analysis onto the kind of waves that may be reflected. Non-reflective 2. Data and Method of Analysis The study is based on the NCEP/NCAR reanalysis data set for late winter (January-March) from 1980 to 2003. We used the daily mean values of the horizontal wind components (u,v) and of the geopotential, , available at 17 standard pressure levels (1000 -10 hPa) with an horizontal grid resolution of 2.5o × 2.5o. The data were projected onto the normal modes of a linearized version of the primitive equations. The normal modes form a complete basis to expand the (u, v, )T vector [Castanheira et al., 2002] where is a diagonal matrix of scaling factors, Gm(p) (see Figure 2) are the vertical structure functions and are the harmonic Hough vectors. The analysis was performed on the transformed space of the wmsl coefficients, whose squares are proportional to the total energies associated with the respective modes. Reflective • Figure 2 - The first five vertical structures, Gm(p). • Figure 1 - Time series of monthly mean U2-10 of January, February and March. The shading indicates the region inside of the long term average ± 0.5 standard deviations (updated from Perlwitz and Harnik [2003]). • 3. Basic Hypotheses • During reflecting periods there must be a trapping of the energy associated with planetary wavenumber 1 in the troposphere and lower stratosphere. In such case, if the source of wave generation remains constant, one may find a higher average energy associated with the planetary ZWN-1 during reflecting periods than the respective average during non-reflecting periods. • Inspecting the energy spectrum differences between reflecting and non-reflecting periods allows the identification of the most important normal modes for projection of upward propagating and reflecting anomalies. 4. Results Figure 3 shows the spectra of energy anomalies from seasonal cycle, for reflecting and non-reflecting configurations (U2-10 below or above a half standard deviation of the long-term average, respectively). Reflecting configuration appears associated with positive anomalies of the energy. We may not attribute the positive anomalies in Figure 3 to reflection only!However, the spectra show a set of modes sensitive to the upper stratospheric circulation. Time-lagged SVD analysis We performed a time-lagged SVD analysis onto the transformed space of 3-D normal modes. Only the normal modes that show large energy differences in Figure 3 were retained in the analysis. The retained modes arel=3, 4, 5, 6 for m=0 (barotropic), and l=2, 3, 4, 5 for m=2 (second baroclinic vertical structure). • Figure 3 - Mean energy anomaly spectra of ZWN-1 planetary (Rossby) modes associated with the barotropic and first four baroclinic components, for reflecting (R) and non-reflecting (NR) stratospheric configurations. Is the source of wave generation constant? A strong negative wind shear in the middle/upper stratosphere must be associated with easterly anomalies of the zonal wind in the upper levels. Such anomalies are associated to upward propagation of planetary waves. Using the ERA-40 reanalysis we computed a daily version of the index U2-10. Next, the new index was filtered using a 10-day moving average. The periods when U2-10 is below the long term average – 0.5std were identified as well as their central dates (referred to as day 0). Figure 4 shows the energy composites for this periods, starting 40 days before the central date and ending 40 days after. • Figure 5 – (left)Covariance of the leading SVD mode between the barotropic and the second baroclinic vertical structures for time lags of -25 to 25 days. (right) Correlations between the time series of the leading SVD mode. The black curves are computed considering all (J,F,M) months. The blue curves are for months with stratospheric reflecting configurations, and the red curves are for non-reflecting configurations. A positive lag means that m=2 is leading. In the case of reflecting configuration, the time-lag between the two maxima is close the sum of time lags for upward and downward propagations as computed by Perlwitz and Harnik [2003]. Hence the analysis here seems to be capturing signals of wave excitation in the troposphere and of the reflected wave in the troposphere. If this is true, we may capture the same signals performing the SVD analysis between fixed and time lagged time series of the barotropic field only. • Figure 4 – Energy composites for the barotropic (l=3,4,5,6), first baroclinic (l=2,3,4) and second baroclinic (l=2,3,4,5) vertical structures. Time-lagged SVD analysis of the barotropic vertical structure • Figure 6 – As in Figure 5 but considering the barotropic field both for the reference and for the lagged time series. Note the two secondary maxima for negative (-11 days) and positive (12 days) lags, as it was expected. • Figure 7 – (left)Tropospheric pattern of the upward propagating wave. (right) Tropospheric pattern of the reflected wave. The patterns are virtually identical for the lags -11 days and 12 days. We note also that these patterns are very close to the tropospheric patterns computed by Perlwitz and Graf [2001] for the troposphere-stratosphere coupling under strong vortex conditions. • 5. Conclusions • During periods when the middle/upper stratosphere circulation has a reflecting configuration, the mean anomalies of the energy associated to planetary wavenumber 1, in the troposphere and lower stratosphere, are positive. However the positive anomalies cannot be attributed to reflection only. The wave generation does not appear to be constant. • A time-lagged SVD on the restricted space of the normal modes that show large energy differences between reflecting and non-reflecting configuration allows the identification of statistical signals that may be interpreted as the tropospheric upward propagating wave and the tropospheric reflected wave. • References • Castanheira, J. M., H.-F. Graf, C. DaCamara and A. Rocha, 2002: Using a physical reference frame to study Global Circulation Variability. J. Atmos. Sci..,59, 1490-1501. • Perlwitz, J. and H.-F. Graf, 2001:Troposphere–stratosphere dynamic coupling under strong and weak polar vortex conditions. Geophys. Res. Lett.,28, 271-274. • Perlwitz, J. and N. Harnik, 2003: Observational evidence of a stratospheric influence on the troposphere by planetary wave reflection. J. Climate,16, 3011-3026.