1 / 8

Species Transport Analysis in Various National Parks: Everglades, Big Bend, Great Smoky, Lincoln Brook

Explore data on transporting different species, sulfates, nitrates, and SEf to specific sites across national parks. Discover patterns on 2004-07-20, including concentration percentiles and average data. Utilize DKenski metric for OCf concentration field analysis.

moira
Download Presentation

Species Transport Analysis in Various National Parks: Everglades, Big Bend, Great Smoky, Lincoln Brook

An Image/Link below is provided (as is) to download presentation Download Policy: Content on the Website is provided to you AS IS for your information and personal use and may not be sold / licensed / shared on other websites without getting consent from its author. Content is provided to you AS IS for your information and personal use only. Download presentation by click this link. While downloading, if for some reason you are not able to download a presentation, the publisher may have deleted the file from their server. During download, if you can't get a presentation, the file might be deleted by the publisher.

E N D

Presentation Transcript


  1. Transport of Different Species for Everglades, FL

  2. Transport of SEf to Different Sites

  3. Transport of NO3f to Different Sites

  4. Sulfate Transport to BIBE, GRSM and LYBR All Data 80-100 Percentile 0-20 Percentile Big Bend, TX Great Smoky, TN Lynbrook, VT

  5. Sulfate Transport Pattern on 2004-07-20 All Data SO4 > 5 SO4 > 15

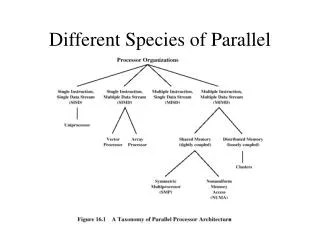
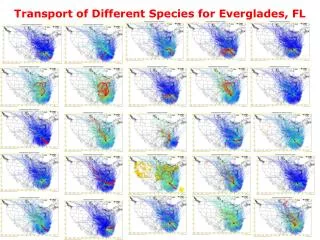
  6. Average Concentration of Different Species -DKenski Metricyou guess the species 

  7. OCf Concentration Field (DKenski Metric) Avg. 98 Percentile Avg. 95 Percentile Avg. 90 Percentile Avg. 80 Percentile Average, All Data

  8. Other Stuff

More Related