Sampling Techniques
Sampling Techniques. During today’s lesson you will: Identify common sampling methods Determine the best sample population to obtain valid, reliable results Compare data with the way it is represented to determine bias. How many pieces must I sample?. Vocabulary. Sampling.

Sampling Techniques
E N D
Presentation Transcript
Sampling Techniques During today’s lesson you will: Identify common sampling methods Determine the best sample population to obtain valid, reliable results Compare data with the way it is represented to determine bias How many pieces must I sample?
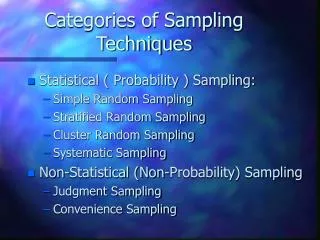
Vocabulary Sampling _________ - collection of data from a group/population Common Sampling Methods _______________ - each member of the group has the same chance of being chosen __________________ - members of the population who are readily available are chosen Random sampling Convenience sampling
Sampling bias ________________ - is when a sample is collected in such a way that some members of the intended population are less likely to be included than others NOTE: If a sample is a group representative of the population, the results will better reflect the opinions of the entire population.
EXAMPLE: Choosing a Sample Friends from his local neighborhood Members of the school sports teams Community members who attend sporting events Every tenth name in the local telephone directory Cal Q. Later wants to conduct a telephone survey to determine if residents of Seneca Valley School District want to pay $900,000.00 to upgrade the press box on the football field. Which of these would be the best sample to use?
CHECK POINT: Choosing a Sample What are some clues that some of the previous samples may not be representative of the whole population? How did you determine that “d. choosing every tenth name from the local phone” directory was the best sample population?
EXAMPLE: Selecting a Data Display NOTE: By displaying data in ways that make the data seem different from what they actually are, we can show bias. Meg A. Byte’s tutor wants to show her very slow improvement in Geometry over the past five months. She created a line graph to show how little her scores have improved during this time.
CHECK POINT: Selecting a Data Display Does Meg’s tutor’s line graph show bias? In what ways can the data be more accurately displayed? Hint: Compare the axes with the scale. What do you notice? Redraw the graph with the numbers on the vertical scale more spread out (start with 60, increasing by 2 units to 70).
Final Checks for Understanding Open-Ended: A newspaper chain called 200 people randomly at home at 1:30 in the afternoon to determine if they would vote yes or no to support a local tax increase to build a baby wading pool in the local community park. Describe a possible bias in the survey.