Welcome to MM207!
200 likes | 299 Views
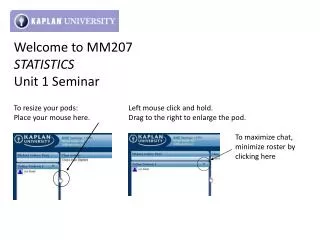
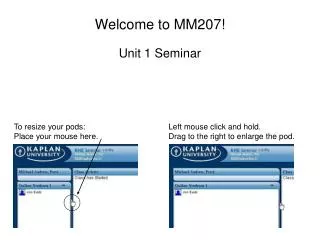
Welcome to MM207!. To resize your pods: Place your mouse here. Left mouse click and hold. Drag to the right to enlarge the pod. Unit 1 Seminar. Seminar Outline. Welcome! Brief Syllabus Review Contact Information for Instructor Course Materials Home Page Features Excel Action Plan

Welcome to MM207!
E N D
Presentation Transcript
Welcome to MM207! To resize your pods: Place your mouse here. Left mouse click and hold. Drag to the right to enlarge the pod. Unit 1 Seminar
Seminar Outline • Welcome! • Brief Syllabus Review • Contact Information for Instructor • Course Materials • Home Page Features • Excel • Action Plan • Seminar Rules • Unit 1 Topics
Syllabus Highlights • Due DatesAll learning activities for a unit are due by Tuesday 11:59 pm ET. • Late penaltiesProjects: 2% per day lateDiscussion Threads: 10% per week late • All late assignments due by the last Sunday in the term: 11:59 pm ET
Instructor Contact Information • Instructor: Dr. Karen Lassiter • Email: klassiter@kaplan.edu • Office hours (AIM): DtrLassiter • By appointment or phone: 575-257-4909
Course Materials • Text book • Student Solutions Manual • Technology Manual for Excel 2007
Home Page Features • Announcements • Doc Sharing • Unit 11 • Unit Links • MML Ungraded Tutorials
Action Plan for Success 1 – Read the text chapter before seminar 2 – Attend seminar(s) 3 – Watch the MML tutorials and do the MML tutorial practice 4 – Complete the MML Project and text practice problems (as needed, the odd numbered problems) 5 – Start the Word Project (located in Doc sharing) 6 – Post to the discussion board throughout the week.
Ask Questions! Do not wait until Tuesday night. Office Hours: By appointment . Phone 575-257-4909 Email questions any time. Tutoring is available in the Math Center most days and evenings. Go to My Studies, Academic Support Center on the Kaplan page. Tutoring is also available through Pearson, MML Tutoring Services link is under Course Home.
Seminar Rules and Structure • Usual format of seminar will involve discussion of a concept and then responding to questions I post on the concept. • Posting a wrong answer will not negatively affect your participation grade. It is more important that you try to participate rather than simply watch. • Social posts (It is raining, Hi, Bye, My car broke down) will not help your participation grade.
Types of Data Quantitative dataQuantitative data has a value or a numerical measurement for which you can calculate sums, products and other numerical calculations. You can measure it, miles per gallon, weight, age, etc. Qualitative dataQualitative data is grouped into a category or group. Sums, products or other numerical calculations do not mean anything. You can only count it, football jerseys, assigning numbers to gender, college major, state of residence, etc.
Population, Sample, Data Sets • Population: The collection of all outcomes, responses, measurements, or counts that are of interest • Sample: A subset of the population • Data Sets: The information coming from a population or sample.
Classifying a Data Set Determine if the data set comes from a population or sample • The age of every member of the Senate • A survey of 300 home owners in a town with 34,000 homes.
Identify the Population and Sample • A survey of 1500 adults in the United States found that 25% prefer Sprite. • A study of 50 children in one school was conducted to find a link between school performance and eating a good breakfast.
Levels of Data Measurement, page 14 Nominal: Data is put in categories using names, labels, or qualities. Examples: names of cities, political parties, telephone numbers. Ordinal: Data is put in ordered categories or ranked. Differences between data entries are not meaningful. Examples: ranking of cities or TV shows; small, medium, large
Levels of Data Measurement Interval: Data can be ordered and calculations made. Subtraction is meaningful. A zero entry is a position on a scale, not an inherent zero point. Examples: temperature, highest grade level completed, year of graduation Ratio: Data can be ordered, calculations made, and it has an inherent zero point. A data point can be meaningfully expressed as a multiple of another data point. Examples: Heights of corn plants, terms in school, snowfall amounts, taxes paid
Sampling • The KEY for all statistical analysis is the sample has been randomly drawn. • Types of Random Samples • Simple • Stratified • Cluster • Systematic • Non-Random Samples • Convenience
Sampling • Random sampling – every group of size n in the population has an equal chance of being selected. • Stratified sampling – population is divided into strata, a random sampling is conducted for each strata • Cluster sampling – population falls into naturally occurring clusters, randomly sample clusters • Systematic sampling – assign numbers to each member of the population, select every nth number • Convenience sampling – sample whoever is available • Question: Would this class be a representative sample of Kaplan University students?
Excel is Required for this Course Excel Resources: Course Extras, Doc Sharing. Microsoft Excel Help, The Math Center, Dr. Robert Lockwood’s website (below) Excel 2003 Help http://office.microsoft.com/en-us/excel/FX100646961033.aspx?ofcresset=1 Excel 2007 Help http://office.microsoft.com/en-us/excel/FX100646951033.aspx GCFLearnFree.org http://www.drboblockwood.com
Installing Data Analysis [2003] • Click on Tools • The dropdown menu should include Add Ins. • Click on Add Ins • From the dialog box select Analysis ToolPak and Analysis ToolPak VBA • Click OK [it may say that it is not installed, do you want to install….answer yes] • Go back and click Tools • You should see “Data Analysis” listed in the drop down menu
Installing Data Analysis [2007] • Open Excel • Click the Office button in the upper left corner of the screen • Select Excel Options [located on the bottom right of the dropdown box] • You will then see Manage ADD INS at the bottom. Click GO • Select Analysis ToolPak and Analysis ToolPak VBA • Click OK • You should then find “Data Analysis” under the Data Tab in the menu bar on the far right side