Download
1 / 75
750 likes | 903 Views
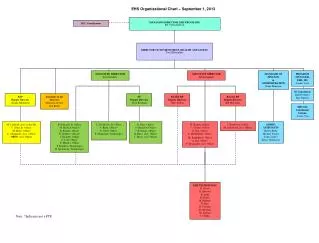
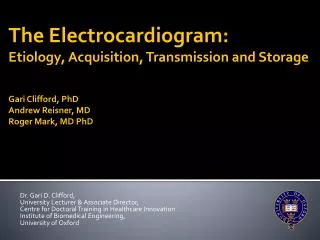
The Electrocardiogram: Etiology, Acquisition, Transmission and Storage Gari Clifford, PhD Andrew Reisner, MD Roger Mark, MD PhD. Dr. Gari D. Clifford, University Lecturer & Associate Director, Centre for Doctoral Training in Healthcare Innovation Institute of Biomedical Engineering,

E N D
The Electrocardiogram: Etiology, Acquisition, Transmission and StorageGari Clifford, PhDAndrew Reisner, MDRoger Mark, MD PhD Dr. Gari D. Clifford, University Lecturer & Associate Director, Centre for Doctoral Training in Healthcare Innovation Institute of Biomedical Engineering, University of Oxford
Electrocardiography The heart is an electrical organ, and its activity can be measured non-invasively Wealth of information related to: The electrical patterns proper The geometry and mechanical properties of the heart’s tissue The metabolic state of the heart Standard tool used in a wide-range of medical evaluations
A heart • Blood circulates, passing near every cell in the body, • driven by this pump (actually, two pumps) - • Atria = turbochargers • Myocardium = muscle • Mechanical systole • Electrical systole
To understand the ECG: Electrophysiology of a single cell How a wave of electrical current propagates through myocardium Specific structures of the heart through which the electrical wave travels How that leads to a measurable signal on the surface of the body
Part I: Cell electrophysiology Each myocyte (muscle cell) contains myofibrils (long chains of sarcomeres), the contractile units of the cell. There are various specialized forms of myocytes: cardiac, skeletal, and smooth muscle cells, with various properties. Cardiac myocytes (like those at the SA node) are responsible for generating the electrical impulses that control the heart rate, among other things. There are around 2x10⁹ muscle cells in normal hearts of children and adult humans, and may rise to 4x10⁹ in excessively hypertrophied hearts.
Cell dynamics K+ K+ 2 K+ 3 Na+ ATPase
a myocyte time Intracellular millivoltage Resting comfortably -90
Depolarizing trigger time Intracellular millivoltage
Na channels open, briefly time Intracellular millivoltage
Mystery current time Intracellular millivoltage In: Na+
Ca++ is in balance with K+ out time Intracellular millivoltage In: Na+
More K+ out; Ca++ flow halts Ca++ in; K+ out time Intracellular millivoltage In: Na+
Sodium channels reset In: Ca++; Out: K+ time Intracellular millivoltage In: Na+ Out: K+
Slow current of Na+ in; note the resting potential is less negative in a pacemaker cell a pacemaker cell time Intracellular millivoltage -55
Threshold voltage a pacemaker cell time Intracellular millivoltage -40
Ca++ flows in time Intracellular millivoltage
. . . and K+ flows out time Intracellular millivoltage
. . . and when it is negative again, a few Na+ channels open time Intracellular millivoltage
How a wave of electrical current propagates through myocardium Typically, an impulse originating anywhere in the myocardium will propagate throughout the heart Cells communicate electrically via “gap junctions” Behaves as a “syncytium” Think of the “wave” at a football game!
The Idealized Spherical Torso with the Centrally Located Cardiac Source (Simple dipole model)
The dipole field due to current flow in a myocardial cell at the advancing front of depolarization. Vm is the transmembrane potential.
The temporal pattern of the heart vector combined with the geometry of the standard frontal plane limb leads.
Vagal stimulation makes the resting potential MORE NEGATIVE. . . Neurohumeral factors time Intracellular millivoltage
Neurohumeral factors time Intracellular millivoltage . . . and the pacemaker current SLOWER. . .
. . . and raise the THRESHOLD time Intracellular millivoltage
Catecholamines make the resting potential MORE EXCITED. . . time Intracellular millivoltage
. . . and speed the PACEMAKER CURRENT. . . time Intracellular millivoltage
. . . and lower the THRESHOLD FOR DISCHARGE. . . time Intracellular millivoltage
time Intracellular millivoltage Vagal Stimulation:
time Intracellular millivoltage Adrenergic Stim.
Arrhythmias - Not firing when you should - Firing when you shouldn't - All of the above (Reentrance)
Usually just a spark; rarely sufficient for an explosion “Leakiness” leads to pacemaker-like current Early after-depolarization Late after-depolarization Firing when you shouldn't
Wave-front Trajectory in a Ventricular Premature Contraction.