Download
1 / 1
10 likes | 82 Views
Utilizing GIS software for accurate and efficient soil prediction, focusing on heaving potential of clay soils along SH 130 route in Texas. Data sourced from county soil surveys and ongoing research. Model developed using ArcView GIS 3.2. Reduce labor with predictive map.

E N D
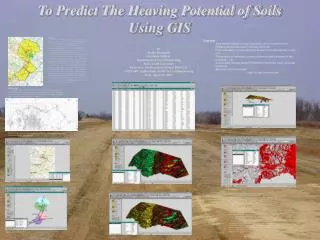
To Predict The Heaving Potential of Soils Using GIS Abstract The dependency on software programs has increased now-a-days for its accuracy and the speed with which it can complete the job. Geographic Information System is one such application. With the use of programs like ArcView GIS 3.2 or ArcView GIS 8.2 the soil parameters and certain other predictions like determining heaving potential of soils can be predicted with greater amount of accuracy and in very less time. The objective of my project is to determine the heaving potential of clay bearing soils. The data I needed partly came the county soil survey report and partly from the ongoing research. My area of interest is soil strip along the route SH 130. SH 130 is a new pavement coming up between Seguin (San Antonio) and Georgetown (Austin). SH 130 connect I 35 and I 10. The model I am going to develop using ArcView GIS 3.2 will predict the high heaving potential areas. The model predicts the areas solely on the data that I have entered into the attribute table. Heaving potential is predicted only in Williamson County as of now because of the time constraint. • Overview • A pavement surface course is generally one of the two forms: Portland cement concrete or asphalt concrete. • Lime stabilization comes into picture when the subgrade soil is very soft. • The problem of heaving is common when sulfate is present in the subgrade soil. • A secondary mineral called ETTRINGITE is formed under favorable conditions. • Abundant amount of water • High Sulfate concentration By Sachin Kunagalli Graduate Student Department of Civil Engineering Texas A&M University Instructor: Dr Francisco Olivera, PhD, P.E CVEN 689: Applications of GIS to Civil Engineering Date: April 29, 2003 Methodology The data I have used is shape file of soils of all the four counties from SSURGO. I have the scanned images of the route of SH 130. The data of soil swell and water capacity from the county soil survey report from USDA and sulfate from the ongoing research are obtained. Sulfate The next step was to develop the grid map of SH 130. This map is giving us the co-ordinates of new road (SH 130). Attribute table with all the values for calcium carbonate soil swell, water capacity and sulfate. Grid map of SH 130 Soil swell Heaving potential areas • Application, results, discussion and Conclusions • The study area I have chosen involves four counties i.e. Williamson, Travis, Caldwell and Guadalupe. SH 130 is road going through all the four counties. The data that I used for the project are soils data from SSURGO, scanned images of SH 130 and the County soil survey report from USDA. • The map that I have developed has the capacity to • Predict heaving potential areas. • Reduces time to predict these areas. • Gives the mineral compositions like sulfate, calcium carbonate, soil swell and the water capacity for whole of Williamson County. • This map can be used by the engineers to see where heaving is presumed to occur. When once the heaving potential areas are predicted the necessary soil testing can be carried out and the required preventive measures can be taken. By using this map the major labor intensive work of going to field and taking the soil samples along the entire stretch of SH 130 is eliminated. Route map of SH 130 Water capacity