Download

1 / 58
580 likes | 670 Views
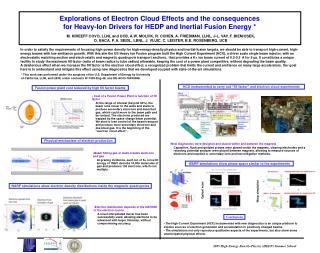
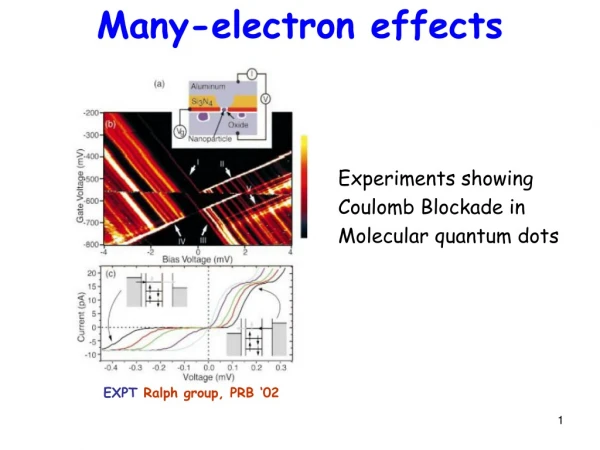
Explore the history and impact of electron cloud effects in KEK, Cesr-TF, and beyond, causing coupled and single bunch instabilities. Learn about electron production, wake forces, and mitigating methods.

E N D
Electron cloud effects in Cesr-TF andKEKB K. OhmiKEK 29 Feb 2008 LEPP, Cornell univ.
Contents • History, electron cloud effect in KEK-PF • Electron cloud build-up at KEKB • Coupled bunch instability caused by electron cloud • Single bunch instability caused by electron cloud • Electron cloud effects in Cesr-TF
History • Coupled-bunch instability had been observed at KEK-PF. • Interpretation of the instability using photo-electron cloud model. • Strange coupled bunch instability had been observed at CESR. • The instability was observed at BEPC (China). • Study of electron cloud effect for design of KEKB. • Studies for PSR, LHC, SPS, SNS, JPARC, ILC …many machines.
Multi-bunch instability observed at KEK-PF • KEK-PF is a 2nd generation light source operated by both of positron and electron beams. E=2.5 GeV L=186 m, Frf=500MHz. • Instability was observed at multi-bunch operation of positron beam. Nbunch=200-300 for h=312. • Very low threshold. I~15-20mA. • The instability was not observed at electron beam operation. • Had similar instability been observed at DORIS? Multi mode instability (197~ or 198~?) • CESR, Electrons leak from Vacuum pump (J. Rogers et al.,).
BPM spectrum for V motion. Electron 354 mA Positron 324 mA & 240 mA Izawa et.al., Phys. Rev. Lett. 74, 5044 (1995).
Interpretation of instability due to photo-electron cloud • Positron beam emits synchrotron radiation. • Electrons are produced at the chamber wall by photoemission. Production efficiency ~ 0.1e-/g. • Electrons are attracted and interacts with the positron beam, then absorbed at the chamber wall after several 10 ns. Secondary electrons are emitted according the circumferences. • Electrons are supplied continuously for multi-bunch operation with a narrow spacing, therefore electron cloud are formed. • A wake force is induced by the electron cloud, with the result that coupled bunch instability is caused. K. Ohmi, Phys. Rev. Lett., 75, 1526 (1995).
First figure for electron cloud build-up Model y x Secondary e- e- g e+ beam Beam chamber PRL,75,1526 (1995) Recipes for electron cloud build-up are written in this paper.
Number of produced electrons Number of photon emitted by a positron par unit meter. • Bunch population Np=3.3x10¹⁰ (KEKB-LERdesign2.6A) Np=5x10⁹(KEK-PF400mA) • Quantum efficiency (h=np.e./ng) 0.1 • Energy distribution 10±5 eV • KEKB-LER Yp.e.=0.015 e-/m.e+ • KEK-PF Yp.e.=0.17 e-/m.e+ , • ionization 10-8 e-/m.e+ , proton loss(PSR) 4x10⁻⁶ e-/m.p a : fine structure const=1/137 • KEKB-LER g=6850 Yg=0.15/m • KEK-PF =4892 Yg=1.7/m
Electron cloud density given by simulation 60 bunches pass in every 8ns (KEKB).
Measurement of electron cloud(Y. Suetsugu, K. Kanazawa et.al.) This measurement gives electron cloud absorption rate(=production rate in equilibrium). To estimate the density, storing time should be multiplied. y Schematic view x Secondary e- e- g e+ beam e- Beam field is shielded in actual monitors. Beam chamber Monitor
Experiment and simulation results Ipe=10 mA at I+=600 mA at 1.5 m down stream of Bend.
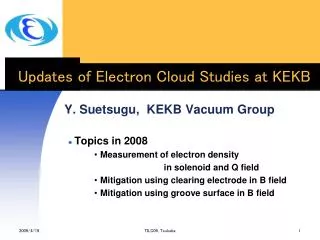
Recent measurement of electron cloud(not recent but 200*) • Electron production rate increase as a function of the beam current. Ie=k Ib1.8 . • Photoemission, . Ie=k Ib. • Index,0.8 ,isduetomultipactoring. Y.Suetsugu, K. Kanazawa ILC-DR 5GeV 400 mA
Coupled-bunch instability (CBI) caused by the electron cloud • Wake field is induced by the electron cloud • Coupled bunch instability due to the wake field causes beam loss.
Wake force and unstable mode for KEK-PF Very fast growth of the coupled bunch instability was explained. K.Ohmi, PRL,75,1526 (1995)
Measurement of the coupled bunch instability in KEKB • Fast amplitude growth which causes beam loss has been observed. • The mode spectrum of the instability depends on excitation of solenoid magnets. Solenoid off on (measurement) M. Tobiyama et al., PRST-AB (2005)
K.Ohmi, PRE55,7550 (1997) K.Ohmi, PAC97, pp1667. Tracking simulation Solve both equations of beam and electrons simultaneously e+bunches y z x ~m Electron cloud Take FFT for the bunch motion
Vertical Simulation Experiment 4 3 x 10 x 10 5 Horizontal Vertical 3 4 Horizontal 3 2 2 1 1 1.2 0.4 0 0 0 200 400 600 800 1000 1200 1400 0 200 400 600 800 1000 1200 1400 Mode Mode Mode 0.3 0.8 0.2 0.4 0.1 0 0 200 400 600 800 1000 1200 1400 0 Mode 0 200 400 600 800 1000 1200 1400 CBI mode spectra in KEKB Solenoid-Off Su Su Win et al,(EC2002) Bunches are filled every 4 bucket.
Effect of Solenoid magnet • Solenoid magnets suppress the electron cloud effect partially. • We can observe electron cloud effect characterized by solenoid magnet. • Cloud distribution (K. Ohmi, APAC98) 10 G 20 G 30 G
Simulation 6 Experiment Solenoid-10 G x 104 2 Horizontal 4 1.5 Horizontal 2 1 0.5 0 0 1500 0 200 400 600 800 1000 1200 1400 Mode 5 Solenoid-10 G Vertical 4 1000 Vertical 3 500 2 1 0 0 200 400 600 800 1000 1200 1400 0 Mode 200 400 600 800 1000 1200 1400 0 0 200 400 600 800 1000 1200 1400 Mode Mode KEKB Solenoid-ON Su Su Win et al., EC2002
Single bunch instabilityVertical Beam size blow up of positron beam at commissioning of KEKB • A beam-size blow-up has been observed above a threshold current. The threshold is given for total current. • The blow-up was observed in multi-bunch operation, but was perhaps single bunch effect. Beam size was measured by putting a bunch with an arbitrary current in a bunch train. • Luminosity is limited by the beam size blow-up. • Synchro-beta sideband induced by electron cloud head-tail instability was observed.
Measurements of the single bunch instability • Beam size blow-up • Synchro-beta sideband ~ny+ ns ny Fukuma et al. J. Flanagan et al.
Head-tail instability model • Simulation using Gaussian model, the same method as the study for CBI. • Wake field approach, the same as CBI. • PIC simulation (like beam-beam strong-strong)
Simulation using Gaussian micro-bunch model y,x y Electron cloud Positron bunch x z E
Bunch head-tail motion w/wo synchrotron motion. Vertical amplitude of the macro-particles in the longitudinal phase space are plotted. Multi-airbag model (z-d) is used to visualize in these figures. K. Ohmi, F. Zimmermann, PRL85, 3821 (2000).
Head-tail and strong head-tail instability • Unstable for Positive chromaticity --- head-tail • Unstable for re= 10x1011 m-3 irrelevant to chromaticity --- strong head-tail ns=0 ns=0.015 x=8 ns=0.015 x=0 re=2x10¹¹ , 4x10¹¹, 10x1011 m-3
Wake field approach • Linearized model. • Numerical calculation including nonlinearity. (Similar way to the calculation of the multi-bunch wake field) K=1 for Linearized model. K~2-3 for the numerical calculation.
Vertical wake field given by the numerical method • (1,1) is consistent with the analytical calculation. • (10,10) is twice larger than (1,1). • Instability threshold is calculated by the wake force. Q=5~10 K. Ohmi, F. Zimmermann, E. Perevedentsev, PRE65,016502 (2001)
Threshold of strong head-tail instability • Mode coupling theory Threshold : re=1-2x10¹²m-3 • Coasting beam model Threshold : re=5x10¹¹m-3 • Coasting beam model is better coincident with simulation. Q=min(Qnl, wesz/c)
Simulation with Particle In Cell method • Electron clouds are put at several positions in a ring. • Beam-could interaction is calculated by solving 2 dimensional Poisson equation on the transverse plane. • A bunch is sliced into 20-30 pieces along the length.
PIC simulation Snap shot of beam and cloud shape for ns=0 and ns>0 BBU Head-tail motion Pink: size along bunch length yellow: <y> of cloud Dark blue: <y> of bunch
Threshold behavior • ns=0 no threshold, ns>0 clear threshold. • re,th=5x10¹¹m-3 • The cloud density is consistent with that predicted by the measurement of electron current. • This beam size blow-up can be understood as strong head-tail instability caused by electron cloud.
Solenoid winding in KEKB ring (0) C-yoke permanent magnets are attached in the arc section of ~800m (1) Solenoids are wound in the arc section of 800m (Sep. 2000). (2) Solenoids are wound additionally in the arc section of 500m (Jan. 2001). (3) Solenoids are wound in the straight section of *100m (Apr. 2001). (4) Add solenoids even in short free space (August 2001). (5) 95 % of drift space is covered (~2005). (6) Solenoid in ¼ of quadrupole magnets (2005)
Luminosity for Solenoids ON/OFF • When solenoids turn off, stored current is limited to a lower value than usual operation due to beam loss (coupled bunch instability). • Luminosity is quite low (~half). Specific Luminosity for Solenoid ON/OFF (measurement at May.2001) Solenoid ON L/I+I- OFF I+I-
Effect of additional solenoidTypical luminosity behavior at Dec. 2000 and March. 2001 Longer and longer • Adding solenoid, positron current with peak luminosity increases. • Now peak luminosity is given at around 1600-1800 mA. L (x1030) 1300 m Solenoid covers 800 m Beam-beam tuning also improves the luminosity. 750mA
Measurement of synchro-beta sideband - evidence for head-tail instability • If the beam size blow-up is due to head-tail instability, a synchro-betatron sideband should be observed above the instability threshold. • The sideband spectra was observed with a bunch oscillation recorder. • The threshold was consistent with simulations. • The sideband appear near ~ny+ns, while simulation gives ~ny-ns, like ordinary strong head-tail instability.
Fourier power spectrum of BPM data Synchrotron Tune V. Tune Sideband Peak 100 Bunch 1 0.5 • LER single beam, 4 trains, 100 bunches per train, 4 rf bucket spacing • Solenoids off: beam size increased from 60 mm ->283 mm at 400 mA • Vertical feedback gain lowered • This brings out the vertical tune without external excitationBunch Spacing vs Spec. Lum.Luminosity-bunch current-sideband experiment • Measure as a function of bunch current. • Sideband is measured for noncolliding bunch. Tune 1.0 J. Flanagan et al., PRL94, 054801 (2005)
Electron cloud induced head-tail instability Simulation (PEHTS) HEADTAIL gives similar results • E. Benedetto, K. Ohmi, J. Flanagan • Measurement at KEKB Betatron sideband Tail of train Head of train Head-tail regime Incoherent regime
Feedback does not suppress the sideband • Bunch by bunch feedback suppress only betatron amplitude. Betatron sideband Simulation (PEHTS) Sideband signal is Integrated over the train
Electron cloud effect in CESR, CesrTF and KEKB-lowe • Tune shift measurement and electron build-up. • Coupled bunch instability • Single bunch instability • Incoherent emittance growth
Number of produced electrons Number of photon emitted by a positron par unit bending angle. • Bunch population Np=2x10¹⁰ • electrons created by a bunch passage in a meter NpxYpe=1.7x10⁹ (5GeV) 6.8x10⁸ (2GeV) If electrons are accumulated 5 times, • electron line density (m-1) 8.5x10⁹ (5GeV), 3.4x10⁹ (2GeV) • volume density(m-3) 1.7x10¹², 6.8x10¹¹ • Corresponding Tune shift 0.0037, 0.0037 (7.4e-4/bunch) • Beam line density Np/4.2=4.8x109 Quantum eff.=0.1 • CESR 5GeV g=10000 Ype=0.086/m, Ec=3 keV • Cesr-TF 2GeV (arc) =4000 Ype=0.034/m, Ec=100 eV
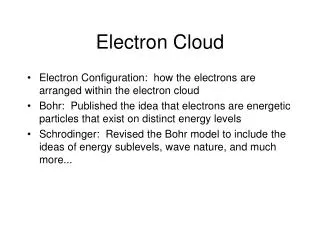
Tune shift • 2nd order moment (<xe2>c, <ye2>c) of electron cloud distribution gives tune shift., where <x2>c=<x-<x>>2. if x~y
Tune shift at KEKB (T. Ieiri, Proceedings of Ecloud07) • Both showed similar density because of x+y=0.015 and 0.012 With solenoid Without solenoid
Tune shift at CESR =30m N=1.2x10¹⁰ Dny=0.1 kHz/bunch
Tune shift for 5.3 GeV in CESR • 5.3 GeV 5 bunch (D. Rice, Sep 06) • Tune shift is similar as that for 1.9 GeV. • Cloud density is linear for . • Sign of photoelectron dominant Dny=0.1 kHz/bunch
Measured tune shift is 1/3 of the simple estimation • Maybe reasonable considering magnetic field • Electron distribution depends on magnetic filed Straight section Magnetic field section cloud beam ny>nxny~ -nx>0
Wiggler section • 1.3m (1m effective)x12, 2.1T, qtot=3.78 rad. • Npe,tot=15.9x2x1010=3.2x10¹¹ (5.2x10¹¹ in arc). • If the electrons localized in 20 m (for example), electrons are accumulated by Npe=2.6x10¹⁰ m-1bunch-1. • Beam line density Np/4.2=4.8x109 m-1. • Electron production and buildup are suppressed by the space charge (neutralization) limit. • Arc is dominant for the electron cloud tune shift and instabilities in CESR.
Coupled bunch instability • Np=1x10¹⁰, 4 ns spacing. • Growth time ~25 turn, 64 msec. • Since tune shift is 1/3 of the estimation, the growth may be also 1/3.