Download
1 / 47
470 likes | 488 Views
Metrics and Monitoring on FermiGrid. Keith Chadwick Fermilab chadwick@fnal.gov. Outline. FermiGrid Introduction and Background Metrics Service Monitoring Availability (Acceptance) Monitoring Dashboard Lessons Learned Future Plans. Personnel.

E N D
Metrics and MonitoringonFermiGrid Keith Chadwick Fermilab chadwick@fnal.gov
Outline • FermiGrid Introduction and Background • Metrics • Service Monitoring • Availability (Acceptance) Monitoring • Dashboard • Lessons Learned • Future Plans FermiGrid Metrics and Monitoring
Personnel • Eileen Berman, Fermilab, Batavia, IL 60510 berman@fnal.gov • Philippe Canal, Fermilab, Batavia, IL 60510 pcanal@fnal.gov • Keith Chadwick, Fermilab, Batavia, IL 60510 chadwick@fnal.gov * • David Dykstra, Fermilab, Batavia, IL 60510 dwd@fnal.gov • Ted Hesselroth, Fermilab, Batavia, IL, 60510 tdh@fnal.gov • Gabriele Garzoglio, Fermilab, Batavia, IL 60510 garzogli@fnal.gov • Chris Green, Fermilab, Batavia, IL 60510 greenc@fnal.gov • Tanya Levshina, Fermilab, Batavia, IL 60510 tlevshin@fnal.gov • Don Petravick, Fermilab, Batavia, IL 60510 petravick@fnal.gov • Ruth Pordes, Fermilab, Batavia, IL 60510 ruth@fnal.gov • Valery Sergeev, Fermilab, Batavia, IL 60510 sergeev@fnal.gov * • Igor Sfiligoi, Fermilab, Batavia, IL 60510 sfiligoi@fnal.gov • Neha Sharma Batavia, IL 60510 neha@fnal.gov * • Steven Timm, Fermilab, Batavia, IL 60510 timm@fnal.gov * • D.R. Yocum, Fermilab, Batavia, IL 60510 yocum@fnal.gov * • FermiGrid Web Site & Additional Documentation: • http://fermigrid.fnal.gov/ FermiGrid Metrics and Monitoring
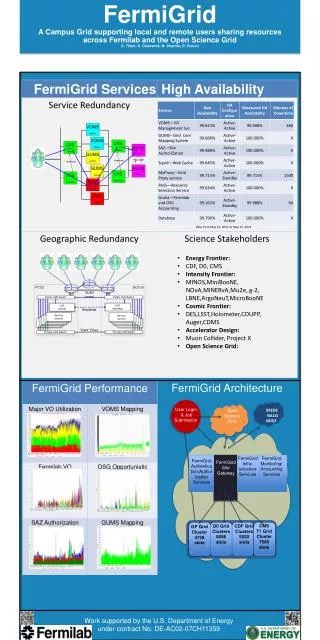
FermiGrid - Current Architecture Step 2 - user issues voms-proxy-init user receives voms signed credentials Step 5 – Gateway requests GUMS Mapping based on VO & Role Step 3 – user submits their grid job via globus-job-run, globus-job-submit, or condor-g Step 4 – Gateway checks against Site Authorization Service Step 6 - Grid job is forwarded to target cluster VOMRS Server Periodic Synchronization VOMS Server Periodic Synchronization GUMS Server Step 1 - user registers with VO Site Wide Gateway Gratia clusters send ClassAds via CEMon to the site wide gateway SAZ Server FERMIGRID SE (dcache SRM) BlueArc Exterior Interior CMS WC1 CMS WC2 CMS WC3 CDF OSG1 CDF OSG2 D0 CAB1 D0 CAB2 GP Farm GP MPI FermiGrid Metrics and Monitoring
FermiGrid - Software Stack • Baseline: • SL 3.0.x, SL 4.x, SL 5.0 • OSG 0.6.0+0.8.0 (VDT 1.6.1+1.8.1, GT 4, WS-Gram, Pre-WS Gram) • Additional Components: • VOMS (VO Management Service) • VOMRS (VO Membership Registration Service) • GUMS (Grid User Mapping Service) • SAZ (Site AuthoriZation Service) • jobmanager-cemon (job forwarding job manager) • MyProxy (credential storage) • Squid (web proxy cache) • syslog-ng (auditing) • Gratia (accounting) • Xen (virtualization) • Linux Virtual Server (high availability) FermiGrid Metrics and Monitoring
Why Monitor? FermiGrid Metrics and Monitoring
Timeline • FermiGrid services were initially deployed in April 1, 2005. • The first formal metrics collection was commissioned in late August 2005. • Initially a manual process. • Automated during the fall of 2005. • Service monitoring was commissioned in June 2006. • VO Acceptance monitoring was commissioned in August 2006. • Availability monitoring was commissioned in June 2007. FermiGrid Metrics and Monitoring
Metrics vs. Monitoring • Metrics collection: • Takes place once per day. • Service Monitoring: • Takes place multiple times per day (typically once an hour). • May have abilities to detect failed (or about to failed) services, notify administrators and (optionally) restart the service. • Generates capacity planning information. • Acceptance Monitoring: • Does a grid site accept “my” VO and pass a minimal set of tests. • May not guarantee that a real application can run - just that it can get in the door. • Availability Monitoring: • Very lightweight. • Can be run very frequently (multiple times per hour). • Optional automatic notification if results are “unexpected”. • Feeds automatic “Dashboard” and “Summary” displays. FermiGrid Metrics and Monitoring
Metrics Collection - Mechanics • Metrics collection is implemented on FermiGrid as follows: • A central metrics collection system launches the central metrics collection process once per day. • collect_grid_metrics.sh • The central metrics collection process in turn launches copies of itself (secondary metrics collection processes) via ssh across all systems (and the services) that are designated for metrics collection. • collect_grid_metrics.sh <node> <service> <date> <…> • The secondary metrics collection processes identify the system, service and metrics to be collected, and then launch a script which has been custom written to collect the desired metrics from the specified service. • collect-globus-metrics.sh <date> <…> • collect-voms-metrics.sh <date> <…> FermiGrid Metrics and Monitoring
Metrics collected within FermiGrid • Globus Gatekeeper: • # of authenticated, authorized, jobmanager, jobmanager-fork, jobmanager-managedfork • batch (jobmanager-condor, jobmanager-pbs, etc.), jobmanager-condorg, jobmanager-cemon, • jobmanager-mis, default. • # of total IP connections, # of unique IP connections, # of unique IP connections from within Fermilab. • VOMS: • # of voms-proxy-init’s by VO. • # of voms-proxy-init’s by group within the fermilab VO. • # of total IP connections, # of unique IP connections, # of unique IP connections from within Fermilab. • GUMS: • # of successful GUMS mapping calls & # of failed GUMS mapping calls. • # of total certificates, # of unique dn, # of unique mappings, # of unique Vos • # of voms-proxy-inits, # of grid-proxy-inits. • # of total IP connections, # of unique IP connections, # of unique IP connections from within Fermilab. • SAZ: • # of successful SAZ calls & # of rejected SAZ calls. • # of unique DN, # of unique VO, # of unique Role, # of unique CA. • # of total IP connections, # of unique IP connections, # of unique IP connections from within Fermilab. FermiGrid Metrics and Monitoring
Metrics Storage and Publication • Metrics are stored using two mechanisms: • First, they are appended to “.csv” files which contain a leading date followed by tag-value pairs. Example: • 22-Jun-2007,total=5721,success=5698,fails=53 • total_ip=5721,unique_ip=231,fermilab_ip=12 • Second, the “.csv” files are processed and loaded in to round robin databases using rrdtool. • A set of “standard” png plots are automatically generated from the rrdtool databases. • All of these formats (.csv, .rrd and .png) are periodically uploaded from the metrics collection host to the central FermiGrid web server. FermiGrid Metrics and Monitoring
Globus Gatekeeper Metrics 1 FermiGrid Metrics and Monitoring
Globus Gatekeeper Metrics 2 FermiGrid Metrics and Monitoring
VOMS Metrics 1 FermiGrid Metrics and Monitoring
VOMS Metrics 2 FermiGrid Metrics and Monitoring
VOMS Metrics 3 FermiGrid Metrics and Monitoring
GUMS Metrics 1 FermiGrid Metrics and Monitoring
GUMS Metrics 2 FermiGrid Metrics and Monitoring
GUMS Metrics 3 FermiGrid Metrics and Monitoring
SAZ Metrics 1 FermiGrid Metrics and Monitoring
SAZ Metrics 2 FermiGrid Metrics and Monitoring
SAZ Metrics 3 FermiGrid Metrics and Monitoring
Service Monitoring - Mechanics • A central service monitor system launches the central service monitor collection script once per hour. • monitor_grid_script.sh • The central service monitor process in turn launches background copies of itself (secondary service monitor processes) across all systems (and the services) that are designated for service monitoring. • monitor_grid_script.sh • These background copies can be launched either via ssh or grid (I.e. globus-job-run). • The secondary service monitor processes identify the system, service to be monitored, and then launch a script which has been custom written to monitor the specified service. • monitor_<service>_script.sh • monitor_gatekeeper_script.sh • monitor_voms_script.sh • monitor_gums_script.sh • monitor_saz_script.sh FermiGrid Metrics and Monitoring
Service Monitor Configuration • Configuration of the service monitor system is via a central configuration file: • fermigrid0 fermigrid0.fnal.gov master • fermigrid1 root@fermigrid1.fnal.gov publish var/www/html • # • fermigrid0 fermigrid0.fnal.gov vo fermilab • fermigrid1 fermigrid1.fnal.gov gatekeeper • fermigrid2 fermigrid2.fnal.gov voms voms.fnal.gov • fermigrid3 fermigrid3.fnal.gov gums gums.fnal.gov • fermigrid3 fermigrid3.fnal.gov mapping cms • fermigrid3 fermigrid3.fnal.gov mapping dteam • fermigrid4 fermigrid4.fnal.gov saz saz.fnal.gov • fermigrid4 fermigrid4.fnal.gov myproxy myproxy.fnal.gov • fermigrid4 fermigrid4.fnal.gov squid squid.fnal.gov • # • fcdfosg1 fcdfosg1.fnal.gov gatekeeper • fcdfosg2 fcdfosg2.fnal.gov gatekeeper • d0cabosg1 d0cabosg1.fnal.gov gatekeeper ssh:/grid/login/chadwick • d0cabosg2 d0cabosg2.fnal.gov gatekeeper ssh:/grid/login/chadwick • cmsosgce cmsosgce.fnal.gov gatekeeper grid:/uscms/osg/app/fermilab/chadwick • cmsosgce2 cmsosgce2.fnal.gov gatekeeper grid:/uscms/osg/app/fermilab/chadwick FermiGrid Metrics and Monitoring
Service Monitor - Information Collected • Globus Gatekeeper: • # of authenticated, authorized, jobmanager, jobmanager-fork, jobmanager-managedfork, batch (condor, pbs, lsf, etc.), condorg/cemon, mis, default. • The value of uptime, load1, load5 and load15. • VOMS: • # of voms-proxy-init’s • # of apache and tomcat processes • The rss and vmz of the Tomcat VOMS server process. • The value of uptime, load1, load5 and load15. • GUMS: • # of successful GUMS mapping calls & # of failed GUMS mapping calls. • # of apache and tomcat processes • The rss and vmz of the Tomcat GUMS server process. • The value of uptime, load1, load5 and load15. • SAZ: • # of successful SAZ calls & # of rejected SAZ calls. • # of apache and tomcat processes • The rss and vmz of the Tomcat SAZ server process. • The value of uptime, load1, load5 and load15. FermiGrid Metrics and Monitoring
Service Monitor Storage and Publication • Results of the service monitors are stored using two mechanisms: • First, they are appended to “.csv” files which contain a leading time (in seconds from the Unix epoch) followed by tag-value pairs. Example: • time=1182466920,authenticated=42,authorized=26,jobmanager=26 • Second, the “.csv” files are processed and loaded in to round robin databases using rrdtool. • A set of “standard” png plots are automatically generated from the rrdtool databases. • All of these formats (.csv, .rrd and .png) are periodically uploaded from the metrics collection host to the central FermiGrid web server. FermiGrid Metrics and Monitoring
Globus Gatekeeper Monitor 1 FermiGrid Metrics and Monitoring
Globus Gatekeeper Monitor 2 FermiGrid Metrics and Monitoring
VOMS Monitor 1 FermiGrid Metrics and Monitoring
VOMS Monitor 2 FermiGrid Metrics and Monitoring
GUMS Monitor 1 FermiGrid Metrics and Monitoring
Mapping Monitor FermiGrid Metrics and Monitoring
SAZ Monitor 1 FermiGrid Metrics and Monitoring
VO Acceptance Monitoring • Monitor the acceptance of a VO across a Grid in order to: • Identify where the members of the VO can consider running jobs. • Not a guarantee that the job can actually run. • Identify misconfigured sites that advertise that they “support” the VO but to not actually accept jobs from VO members. • Log formal trouble tickets through the OSG GOC. • Ideally have the sites respond and fix their configuration. • Unfortunately some sites have not been very responsive. • And still other sites have responded by removing support for the VO. FermiGrid Metrics and Monitoring
VO Acceptance Monitoring Mechanics • How it is done: • A cron script periodically launches kcroninit. • kcroninit launches a script which does authentication: • kx509 • kxlist -p • Robot certificate “issued” by the Fermilab KCA: • /DC=gov/DC=fnal/O=Fermilab/OU=Robots/CN=cron/CN=Keith Chadwick/UID=chadwick • Get VO signed credentials: • voms-proxy-init -noregen -voms fermilab:/fermilab • Pulls the list of OSG sites from the OSG gridscan reports • http://scan.grid.iu.edu/cgi-bin/get_grid_sv?get=set1 • For each site in the report, the acceptance monitor tests: • Standard Unix ping. • globusrun -a -r (authenticate). • globus-job-run (existing application - typically /usr/bin/id). • globus-url-copy (to and from). • Periodically I review the list of failing sites and if appropriate, log trouble tickets. FermiGrid Metrics and Monitoring
VO Acceptance Monitor 1 FermiGrid Metrics and Monitoring
Availability (Infrastructure) Monitoring • Designed to be very “lightweight”. • Currently running with the service monitor, but designed and implemented so that it can run much more frequently. • Monitors both the host system and the service which is running on the system. • Driven by the same configuration file as the service monitor. • http://fermigrid.fnal.gov/monitor/fermigrid0-ping-monitor.html FermiGrid Metrics and Monitoring
Base Infrastructure Monitor FermiGrid Metrics and Monitoring
Dashboard & Summary Displays • Based on a secondary analyses of the infrastructure monitor data. • Designed to be a simple “health” dashboard and summary display for the user community: • http://fermigrid.fnal.gov/monitor/fermigrid-dashboard.html • http://fermigrid.fnal.gov/monitor/fermigrid-summary.html FermiGrid Metrics and Monitoring
Dashboard - Typical Display 1 FermiGrid Metrics and Monitoring
Dashboard - Typical Display 2 FermiGrid Metrics and Monitoring
FermiGrid Summary - Typical Display FermiGrid Metrics and Monitoring
Lessons Learned 1 • Metrics and Service Monitoring is difficult: • Every service has it’s own log file format (at least today). • find, grep, awk are your friends. • The format of the messages within the service log file will change as new versions of the services are deployed. • Some services don’t log all necessary and/or interesting information “out of the box”, they need additional logging options enabled. • You may have to work with the service developers to insure that they log the necessary service information. • Some services are extremely “talkative” and place lots of information (that I am certain is useful to the developers) in the log file along with the “golden nuggets” that is needed by the metrics collection and service monitoring. • You may have to work with the service developers to insure that they log the necessary service information. • You may have to extract and correlate information from multiple logs. • You must also monitor services that the monitored Grid service depends on (especially apache, tomcat and mysql). FermiGrid Metrics and Monitoring
Lessions Learned 2 • Out of band access and monitoring is quite useful and necessary. • ssh, ksu as well as grid. • Using grid services to monitor other grid services may not correctly identify the problem: • Did some local (non-grid) service fail? • kx509 • kxlist -p • Did the local grid service fail? • voms-proxy-init • Did some intermediate service fail or timeout? • Network congestion • Did the remote grid service fail or timeout? • Globus gatekeeper • globusrun -a -r • globus-job-run • Did a remote service fail or timeout? • NFS server FermiGrid Metrics and Monitoring
Lessons Learned 3 • Service monitoring with automatic service recovery can be very useful. • Especially when responding to automated security probing, • And also for getting a full nights rest… • Automatic service recovery will usually require some level of root access. • Sites are understandably reluctant to grant “remote” root access (I know that I am…). • Robot certificates are extremely useful for automating grid service monitoring. FermiGrid Metrics and Monitoring
Plans for the Future • Continue with the development of additional metrics and monitor probes. • Continue with the development of automated reports & publication. • Integrate/incorporate the new OSG RSV/SAM probes to fermilab VO monitoring. • Work towards making this infrastructure more portable. FermiGrid Metrics and Monitoring
Fin • Any questions? FermiGrid Metrics and Monitoring