Download
1 / 21
210 likes | 228 Views
Social Capital and Blood Donation in the Netherlands. René Bekkers VU University Amsterdam. Ingrid Veldhuizen Sanquin Blood Bank. Proportion of the population registered as a blood donor per municipality, 2005.

E N D
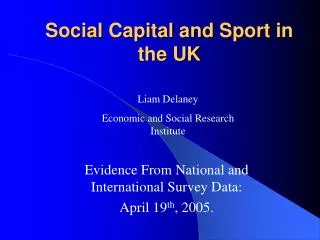
Social Capital and Blood Donation in the Netherlands René Bekkers VU University Amsterdam Ingrid Veldhuizen SanquinBlood Bank 40th Arnova Conference, Toronto
Proportion of the population registered as a blood donor per municipality, 2005. Source: R. Bekkers & I. Veldhuizen (2008). ‘Geographical Differences in Blood Donation and Philanthropy in the Netherlands – What Role for Social Capital?’ Journal of Economic Geography, 99 (4): 483-496. 40th Arnova Conference, Toronto
Our question What is the influence of social capital on philanthropy, viz. blood donation? Does the level of social capital explain geographical differences in blood donation? Does the likelihood of donating blood increase with the level of social capital in the area where you live? 40th Arnova Conference, Toronto
Why this matters Since Coleman (1990) and Putnam (1993, 2000), social capital has become a core concept in the social sciences. By analogy to human capital, social capital stands for the resources you get from their social environment (Lin, 2001). As social capital dwindles, so might the proportion of blood donors in the population. 40th Arnova Conference, Toronto
Measuring social capital Some measures have included blood donation as an indicator of social capital. Along with measures of the level of participation in elections, associations, volunteering, donations, and the level of (generalized) trust. Note: here we look at the influence of social capital on blood donation. 40th Arnova Conference, Toronto
How it might work • As there are more blood donors in your environment…. • You are more likely to know about the possibility and to be asked to donate blood. [>80% of current blood donors were asked.] • You are more likely to say yes to become a blood donor because this seems like a good thing to do. [Piliavin: normative / personal expectations] 40th Arnova Conference, Toronto
The context In the Netherlands, there is only one blood collection agency, Sanquin. Sanquin operates blood collection points in the major cities, and some mobile units. Only about 400,000 individuals (2.5% of the Dutch population) give blood. This makes it difficult to study blood donors using a random sample. 40th Arnova Conference, Toronto
Data on non-donors We took the respondents from the Giving in the Netherlands Panel Survey (GINPS) from the 2008 and 2010 waves and excluded those who reported they had donated blood in the past year (n=2,050). 40th Arnova Conference, Toronto
Data on blood donors The blood collection agency Sanquin selected a random sample of 50,000 blood donors for the prospective cohort study ‘Donor InSight’ in 2008. Here we use data from 28,759 blood donors located in 443 different municipalities who responded (57.5%). The questionnaire included many questions from GINPS. 40th Arnova Conference, Toronto
Two levels The individual: deciding whether or not to donate blood. The municipality: the environment in which individuals make this decision. There is social capital at both levels. We need data on both levels to sort out where the effect of social capital (if any) comes from. 40th Arnova Conference, Toronto
Variables at the two levels • Individual level variables: • Sociodemographics: gender, age, education, income, work status, working hours • Social capital: trust and altruistic values. • Context level (municipality): • Sociodemographics: aggregate measures • Social capital: Voter turnout; voluntary association membership, helping and volunteering intentions 40th Arnova Conference, Toronto
Nesting: ni=30,809; nj=433 Multiple individuals are nested within the same municipality. Intraclass coefficient (rho): how similar are two individuals from the same municipality? We matched the data from individual respondents to the municipality level data using the zipcode of the respondents. 40th Arnova Conference, Toronto
Statistical model You need a statistical model that decomposes the variance at the individual level and the context level. OLS does not do that. It assumes observations are ‘independent’. ‘Hierarchical’ or ‘multilevel’ regression models the dependency between individuals nested in the same context. 40th Arnova Conference, Toronto
Individual level Coefficients are odds ratios in logistic regression including age 70+, work status, income, home ownership, full time / part time work 40th Arnova Conference, Toronto
Municipality level 40th Arnova Conference, Toronto
Blood donation increases with voter turnout Predicted probability Turnout 40th Arnova Conference, Toronto
Conclusions Only about 7% of the variance in blood donation is at the municipality context. About half of this variance is explained by election turnout, civic-mindedness and the presence of other blood donors. Turnout affects blood donation through the presence of other blood donors. Probably through social influence. 40th Arnova Conference, Toronto
Two levels Effects of the same characteristics at the two levels are often markedly different. E.g., 30.1% of blood donors are Catholic vs. only 15.5% of non-donors; a higher % of Catholics in the municipality, however, actually lowers the likelihood of being a blood donor. Higher education also has opposite effects at the individual and context level. 40th Arnova Conference, Toronto
Thanks, says René Bekkers, r.bekkers@vu.nl Blog: renebekkers.wordpress.com Twitter: @renebekkers ‘Giving in the Netherlands’, Center for Philanthropic Studies, Faculty of Social Sciences, VU University Amsterdam: www.geveninnederland.nl 40th Arnova Conference, Toronto