Download
1 / 96
960 likes | 978 Views
Learn about the benefits and challenges of watershed-based NPDES permitting, including improved permit quality, stakeholder involvement, and resource efficiency.

E N D
Benefits of Watershed-Based NPDES Permitting Patrick Bradley, USEPA Water Permits Division Jenny Molloy, USEPA Water Permits Division Robert Steidel, City of Richmond, Department of Public Utilities Federico Maisch, Greeley & Hansen Wednesday, July 19 , 2006 This Webcast is sponsored by EPA's Watershed Academy
Outline • Introduce the concept of watershed-based approaches, including permitting • Wet Weather • Case Study – Richmond, VA • Layering paradigms
What Is Watershed-Based Permitting? An approach to NPDES permitting that results in permits: • Designed to attain watershed goals due to the consideration of all sources/stressors in a watershed or basin • Developed via a watershed planning framework to communicate with stakeholders and integrate permit development among monitoring, water quality standards, TMDL, nonpoint sources, source water protection and other programs
Expected Benefits & Challenges • Benefits • Better quality NPDES permits • Emphasis on environmental results due to watershed planning • Promotes watershed monitoring plans • Encourages efficiencies and targets resources • Increased stakeholder involvement • Challenges • Expanded stakeholder involvement • Integrating nonpoint sources • Transition costs
Who Initiates a Watershed-Based Permitting Approach? • Can start at any level • Permitting authority • Point sources • Watershed organization • Requires support of Permitting Authority and EPA Regional Office
Basic Steps to WBP Step 1: Select a Watershed Step 2: Identify and Engage Stakeholders Step 3: Analyze Watershed Data Step 4: Develop Permit Conditions Step 5: Issue Watershed-Based NPDES Permit(s) Step 6: Measure and Report Progress
Sustainable Water Infrastructure • Our wastewater and drinking water systems are aging • U.S. population is increasing and shifting • Current treatment and management may not be sufficient to address emerging issues and potentially stronger requirements • Investment in R&D has declined • Funding gap: $270 billion for wastewater and $263 billion for drinking water
Sustainable Water Infrastructure • Seek innovative approaches and new technologies to help ensure that the Nation’s water infrastructure is sustainable • Accomplish this through collaboration with external stakeholders and conducting research, in the following 4 “pillar” areas: • Better Management • Water Efficiency • Full Cost Pricing • Watershed-Based Approaches
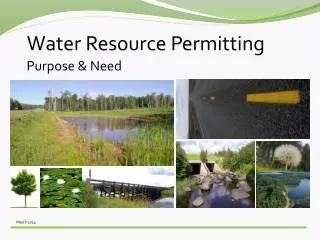
Sustainable Water Infrastructure Watershed Approach Pillar Integrate water utility management and watershed planning, allowing stakeholders to take advantage of the full range of tools and approaches to help them make optimal infrastructure decisions and achieve watershed goals
Key Discussion Areas • Wet weather discharges and what we are doing to control them? • The need for wet weather integration • What might an integrated wet weather program look like?
Wet Weather Overview Municipal wet weather discharges • Combined Sewer Overflows (CSOs) • Sanitary Sewer Overflows (SSOs) • Stormwater runoff • Peak wet weather flows at POTWs • Urban nonpoint sources What is the most effective way to control urban wet weather discharges for the best water quality outcomes?
Wet Weather Overview Wet weather discharges: • Contribute similar pollutants (e.g., BOD, suspended solids, pathogens, toxics) • Collectively contribute to one of the most serious causes of impairment: discharge volume • Often discharge simultaneously • Are variable in terms of event frequency, duration, volume and pollutant load • Often difficult to partition causes of impairment(s) among multiple wet weather sources
EPA’s National Water Quality Inventory 2000 Report identified “municipal point sources” and “urban runoff/storm sewers” as leading sources of impairment Top 3 pollutants in impaired waters: Suspended solids Pathogens Nutrients All three pollutants present in municipal wet weather sources What is the Urban Wet Weather Problem?
Physical and biological impacts of wet weather discharges can be severe e.g., altered hydrology habitat impairment Population growth and new development increasing demands on the urban environment More difficult to achieve and maintain water quality standards in coming years What is the Urban Wet Weather Problem?
Current regulatory, management and funding approaches address wet weather sources under separate Clean Water Act, and sometimes state, programs What is the Urban Wet Weather Problem?
NPDES Universe Stormwater Phase II (115,000) 600 500 CAFOs (15,000) 400 Stormwater Phase I (270,000) Permittees (thousands) 300 Municipal and Industrial Sources (100,000) 200 100 0 1972 1977 1982 1987 1992 1997 2002 17
Average Discharge Source Volume (billion gal.) Treated wastewater 11,425 Urban stormwater 10,068 CSO 850 SSO 10 Total 22,353 What is the Urban Wet Weather Problem? Estimated Annual Municipal Point Source Discharges Report to Congress on the Impacts and Control of CSOs and SSO (EPA 2004)
Source (Annual Volume) BOD5 (mg/l) TSS (mg/l) Fecal Coliform (colonies/100ml) Treated Wastewater (11,425 BG) 30a 30a <200a Stormwater (10,068 BG) 0.4-370 0.5-4,800 1-5,230,000 CSO (850 BG) 3.9-696 1-4,420 3-40,000,000 SSOb (10 BG) 6-413 10-348 500,000c Pollutant Concentrations in Municipal Point Source Discharges aTypical limit for wastewater receiving secondary treatment/limit for disinfected wastewater bConcentration in wet weather SSOs cMedian concentration (WDNR 2001) 19
What are we Currently Doing?Stormwater Permitting • Regulated Stormwater Discharges: • Stormwater Discharge from MS4s • Stormwater Associated with Industrial Activity • Stormwater Discharges from Construction Sites • “As Designated” Discharges
What are we Currently Doing?Stormwater Permitting 2000 Census, Urban Areas
What are we Currently Doing?Stormwater Permitting • Municipal Stormwater • Phase I - individual permit conditions (6mm+) • Phase II – 6 minimum measures • Industrial Stormwater • Stormwater Pollution Prevention Plan for industrial stormwater discharges • Construction Stormwater • Stormwater Pollution Prevention Plan for construction stormwater discharges; primarily erosion and sedimentation control
What are we Currently Doing?Combined Sewer Overflows Report to Congress on the Impacts and Control of CSOs and SSO (EPA 2004)
What are we Currently Doing?Combined Sewer Overflows • CSOs are point sources subject to NPDES permit requirements • 824 active CSO permits (9,119 discharge points)in 32 states • National CSO Control Policy (1994) • Nine Minimum Controls • Long Term Control Plan • Wet Weather Water Quality Act (2000) • Reports to Congress • “Shall Conform”
CSO Control Policy Implementation • CWA Sec 402(q)(1) -- permits and orders “shall conform to” the 1994 CSO Policy • Encouraging the use of EPA’s Guidance: Coordinating CSO Long-Term Planning With Water Quality Standards Reviews as CSO communities, NPDES and water quality standards authorities, and stakeholders coordinate in the development of LTCPs • Providing Regions and NPDES states with guidance and assistance for reviewing and approving LTCPs
What are we Currently Doing? Sanitary Sewer Overflows National SSS Distribution (15,582 with POTWs; 4,846 satellites)
What are we Currently Doing? Sanitary Sewer Overflows • Not Specifically Addressed under the CWA • EPA does not have a national policy or regulation • Current approach developed ad hoc through implementation of NPDES Permit, Construction Grants, and enforcement • SSO Guidance (CMOM, reporting & recordkeeping, satellite systems)
Report to Congress on CSOs and SSOs KEY MESSAGES • Impacts tend to be more clearly observable at the local watershed level than at the national level • CSOs and SSOs can cause significant environmental and human health impacts at the local watershed level
What are we Currently Doing?Peak Wet Weather Flows at POTWs • National Municipal Policy on Publicly-Owned Treatment Works – focused little attention on management of peak flows • “Blending”/”Peak Flows” • Management of peak wet weather flows by routing some peak flow around treatment units, blending the rerouted flow with the flow receiving full treatment; and disinfecting if required • Proposed Blending Policy (99,000+ comments received) • New proposed policy for “Peak Flows”
What are we Currently Doing?Nonpoint Source Pollution • No federal regulatory program • Implemented through EPA-approved State programs that include a mix of non-regulatory and regulatory programs as designed by each State • EPA's role focuses on establishing grant requirements that focus State activities on achieving WQ improvement results; providing technical guidance, working with a broad range of partners to promote the widespread demonstration and dissemination of the most effective practices, and supporting outreach and education efforts
What Have We Learned? • Wet weather programs involve sewer pipes and other infrastructure that share capacity, infiltration, and inflow problems • Greater gap between municipal wastewater infrastructure needs and funding • Increasingly difficult decisions about how to allocate limited resources
Current NPDES Framework • Issuing permits for wet weather sources takes time and is resource intensive • Permit-by-Permit Conditions • Difficulty in establishing compliance endpoints • Difficult to assess impacts and program effectiveness • Municipal wet weather discharges are addressed through various regulatory and policy frameworks • Inefficient given commonalities between discharges
Control of Wet Weather Discharges Stormwater Permitting Combined Sewer Overflows Sanitary Sewer Overflows Management of Peak Wet Weather Flows at POTWs (Nonpoint Sources) Integrated Wet Weather Programs
Wet Weather Integration • Relatively few communities have an integrated permit or manage wet weather issues collectively • EPA working to identify what has slowed progress to date and what could promote further integration
Wet Weather Integration in Urban Areas • Gathering information via community interviews: • Communities working to integrate their wet weather programs • Kentucky Sanitation District Number 1 • Communities with integrated permit requirements • Clean Water Services (Oregon) • Communities that collectively manage urban point source issues but do not have an integrated permit • Philadelphia Water Department
Benefits of Wet Weather Integration • Increased flexibility relative to traditional permit requirements that allows permittees to focus on watershed priorities and goals in a systematic and more cohesive manner. • Elimination of redundant data collection, data analysis, and reporting requirements. • Increased opportunities for efficiency, such as the opportunity for cross training and sharing responsibilities across local program activities. • Potential cost savings through the pooling of resources (i.e., GIS applications, monitoring, and modeling).
Benefits of Wet Weather Integration (cont.) • Promotion of a common and well-balanced understanding of watershed priorities, as well as identification of opportunities for improvement. • Encourages a comprehensive view of the watershed that allows evaluation and prioritization of issues at a larger scale, and also allows stakeholders to see water as one resource. • Increases potential to achieve greater environmental benefits relative to traditional approach. • Allow for meaningful coordination with other programs – TMDL, water quality standards, smart growth initiatives
Keeping Water Out of Sewer Systems • Wet weather discharges can be hydraulically connected and controlling one source can have impacts elsewhere in the system • CSO separationstormwater impacts • Reducing volume entering the sewer system • A guiding principle for the integration of wet weather permitting programs • Addresses the interconnectivity across all wet weather programs (CSO, SSO, stormwater, peak POTW flows)
Benefits of Keeping Water Out of Sewer Systems • Preservation of sewer system conveyance capacity • Reduction of stress on existing sewer infrastructure • Abatement of combined sewer overflows (CSOs) and sanitary sewer overflows (SSOs) • Reduction in the volume of storm water and associated pollutant loads delivered to water bodies • Reduction in the erosion and scouring of small urban streams that accompanies storm water discharges
Benefits of Keeping Water Out of Sewer Systems (cont) • Lessening of public health, water quality, and environmental impairment attributable to urban runoff and sewer overflows • Improved effluent quality, on average, from publicly owned treatment works (POTWs) due to lower loads during wet weather • Better management of combined, sanitary, and separate storm sewer systems and permit programs • Improved stream baseflow and groundwater recharge
Keeping Water Out of Sewer Systems • Often a combination of practices to reduce impervious cover, control inflow/infiltration to sewers, promote water conservation, and enhance bio-infiltration are required
Quantify base sewer flow conditions Sanitary sewage (residential, commercial, industrial) Stormwater Quantify flow reductions associated with the following practices: Stormwater runoff reduction Inflow control Infiltration control Water conservation Calculate potential reductions to sewer systems Keeping Water Out of Sewer Systems - Calculator
City of Richmond Watershed Program Case StudiesCity of Richmond 46
Discussion Topics • The City of Richmond and the Middle James River Watershed • Introduction (Tidal & Non-tidal) • CSO Phases I & II Performance • LTCP Alternatives & WQ Model Results • Phase III Long Term Control Plan • WQS Gap • Chesapeake Bay Urban Non-Point Storm Water • Watershed Planning – Endpoint Compliance with WQS • EPA Public Health Guidelines • Geometric Mean and/or Single Sample Maximum • WQ Model Results • E. Coli • Illness Rate
Discussion Topics (Continued) • How Can We Reach this Endpoint • Proposed Path Forward • Watershed Approach - i.e. = CSO control - Case Study Richmond, Virginia • Compare and Contrast – Why the Watershed Approach • Environmental. Outcome • Quality of life • Make sense • Cost Savings for the Public/Rate/Tax Payers
Public City of Richmond, Virginia Adjacent Jurisdictions Henrico Chesterfield Goochland Petersburg Hopewell Colonial Heights DEQ WQS Compliance TMDL Process EPA Non-Governmental Organizations Business Agricultural Manufacturing Watershed Stakeholders
Middle James River Watershed City of Richmond Middle James-Willis Lower James James River Basin