Download
1 / 10
100 likes | 297 Views
Learn about different methods of calculating price indices, their applications in business, and how to compute simple price index numbers. Index numbers express relative changes in count or measurement over time, often focusing on price and quantity.

E N D
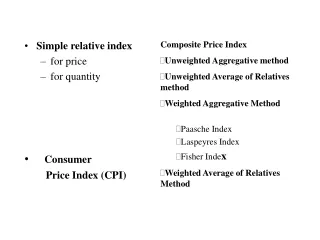
Composite Price Index • Unweighted Aggregative method • Unweighted Average of Relatives method • Weighted Aggregative Method • Paasche Index • Laspeyres Index • Fisher Index • Weighted Average of Relatives Method • Simple relative index • for price • for quantity • Consumer • Price Index (CPI)
What are index numbers? • Index numbers: • are time series that focus on the relative change in a count or measurement over time. • express the count or measurement as a percentage of the comparable count or measurement in a base period. • An index number is a statistical value that measures the change in a variable with respect to time • Two variables often considered in this analysis are price and quantity
Applications of Index Numbers in Business and Economics • A price index shows the change in the price of a commodity or group of commodities over time. • A quantity index shows the change in quantity of a commodity or group of commodities used or purchased over time. • A value index shows a change in total Rs. value (price • quantity) of a commodity or group of commodities over time. • Used to compare: • Prices or Quantity • Can be utilised as: • some measure of the change in things such as ‘the cost of goods and services’
Simple index numbers • Index numbers that are constructed from a single item only • Definitions used for all index numbers: • Current period = the period for which you wish to find the index number • Base period = the period with which you wish to compare prices in the current period
Price relative • The price relative of an item is defined as: Where: pn = price in current period po = price in base period
Current period and base period • Current period can be any period at all • Base period choice often depends on economic factors: • it should be a ‘normal’ period with respect to the relevant index • it should not be chosen too far in the past
Simple price index • Price relative index provides a ratio that indicates the change in price of an item from one period to another. • Simple price index is a common method of expressing this change as a percentage: Where: pn = price in current period po = price in base period
Example: Simple Relative Price Index Price Index Price Index Year Price1980 as base year 1990 as base year 1980 140 100.0 58.3 1985 195 139.3 81.3 1990 240 171.4 100.0 1995 275 196.4 114.6 Computation of index for 1985 (1980 as base year):
Simple price index The simple price index finds the percentage change in the price of an item from one period to another. • If the simple price index is more than 100, subtract 100 from the simple price index. The result is the percentage increase in price from the base period to the current period. • If the simple price index is less than 100 subtract the simple price index from 100. The result is the percentage by which the item cost less in the base period than it does in the current period.
Index numbers • An index number is the ratio of two numbers expressed as a percentage. • In order to calculate an index number, a base period needs to be identified. Values in the current period are then compared to the base period. • The index number for the base period is 100. The index number for the current period is then compared to 100. • For example, an index number of 120 would represent a 20% increase in the item being measured from the base period to the period in question.