Download
1 / 54
540 likes | 568 Views
Learn how Oracle's graph technologies and machine learning algorithms can be used for network intrusion detection and anomaly detection against cyberattacks. Discover the power of graph data modeling for data analysis and visualization within the realm of cybersecurity. <br>

E N D
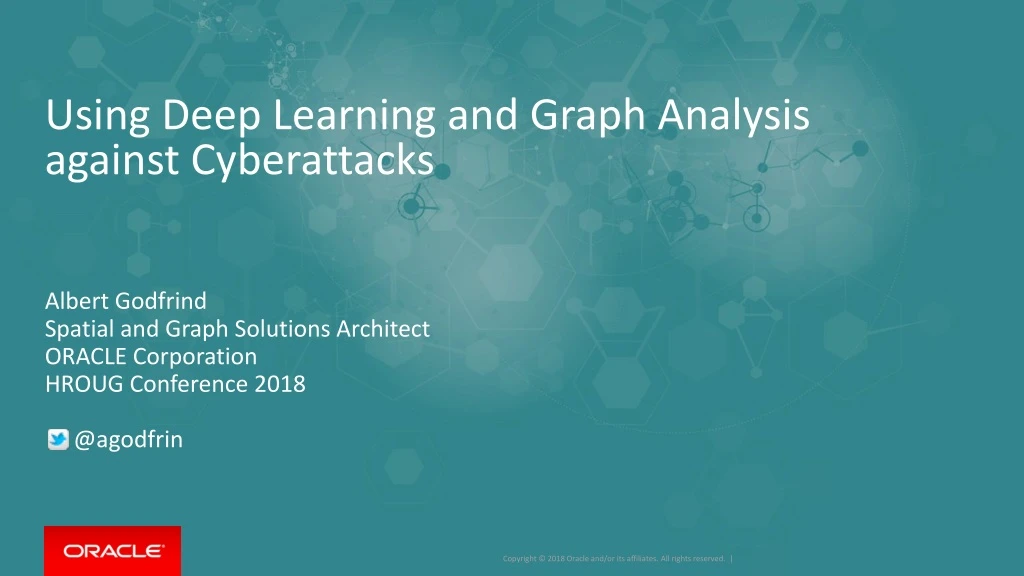
Using Deep Learning and Graph Analysis against Cyberattacks Albert Godfrind Spatial and Graph Solutions Architect ORACLE Corporation HROUG Conference 2018 @agodfrin
In IT for way too long! • With Oracle for ever • Oracle Spatial Evangelist • Graph Evangelist • Author
Agenda Introduction to graph analysis Using Oracle‘s graph technologies to work with graphs Combining graph analysis and machine learning Using machine learning for network intrusion detection Wrap-up 1 2 3 4 5
Following, no follow back Follower, no follow back Follow each other https://twitter.jeffprod.com
A social network generated from Game of Thrones. The color of a vertex indicates its community. The size of a vertex corresponds to its PageRank value, and the size of its label corresponds to its betweenness centrality. An edge’s thickness represents its weight. https://www.macalester.edu/~abeverid/thrones.html
Graph Data Model B C • What is a graph? • Data model representing entities as vertices and relationships as edges • Optionally including attributes • Also known as „linked data“ • What are typical graphs? • Social Networks • LinkedIn, facebook, Google+, ... • IP Networks, physical networks, ... • Knowledge Graphs • Apple SIRI, Google Knowledge Graph, ... A D F E
Graph Data Model B C • Why are graphs popular? • Easy data modeling • „whiteboard friendly“ • Flexible data model • No predefined schema, easily extensible • Particularly useful for sparse data • Insight from graphical representation • Intuitive visualization • Enabling new kinds of analysis • Overcoming some limitations in relational technology • Basis for Machine Learning (Neural Networks) A D F E
Categories of Graph Analysis :worksAt{1831} startDate = ’09/01/2015’ :Person{100} name = ‘Amber’ age = 25 :Company{777} name = ‘Oracle’ location = ‘Redwood City’ :friendOf{1173} :friendOf {2513} since = ’08/01/2014’ Computational Graph Analytics Graph Pattern Matching Based on description of pattern Find all matching sub-graphs :Person{300} name = ‘Heather’ age = 27 :knows{2200} :Person{200} name = ‘Paul’ age = 30 • Compute values on vertices and edges • Traversing graph or iterating over graph (usually repeatedly) • Procedural logic • Examples: • Shortest Path, PageRank, Weakly Connected Components, Centrality, ...
Detecting similarities – Recommentation Engines • Identifying users with similar behaviour or buying pattern • Viewing customer-item relations as large (sparse) matrix • Customers as one dimension, items as other • Matrix cells filled with rating/rank • Represent as graph, not as matrix • Collaborative Filtering [1] algorithm solves taste signature of customers, items • Resulting vectors are like DNA • Inner product of vectors reflects quality of match [0.305 0.888 0.931 ….] [0.758 0.331 0.124 …] [0.758 0.331 0.124 ….] [0.328 0.172 0.519 ….] [0.391 0.551 0.223 …] [0.231 0.119 0.033 ….] [0.112 0.237 0.456 …] [1] https://en.wikipedia.org/wiki/Collaborative_filtering
Detecting Outliers – Graph Analysis and Anomaly Detection • Requirement: • Identify entities from a large dataset that look different than others, especially in their relationships • Approaches: • Define an anomaly pattern, find all instances of the pattern in the graph • Given nodes in the same category, find nodes that stand out (eg. low Pagerank value)
Use case: Fraud Detection in Healthcare • Example for potential fraud detection • Public domain dataset • Medical providers and their operations • Question • Are there any medical providers that are suspicious • medical providers that perform different operations than their fellows (e.g. eye doctors doing plastic surgery) • Approach • Create graph between doctors and operations • Apply personalized pagerank (a.k.a equivalent to random walking) • Identify doctors that are far from their fellows Clinics (doctors) Operations
Agenda Introduction to graph analysis Using Oracle‘s graph technologies to work with graphs Combining graph analysis and machine learning Using machine learning for network intrusion detection Wrap-up 1 2 3 4 5
Introducing: Oracle Big Data Spatial and Graph Spatial Analysis: • Location Data Enrichment • Proximity and containment analysis, Clustering • Spatial data preparation (Vector, Raster) • Interactive visualization Property Graph Analysis: • Graph Database • In-memory Analysis Engine • Scalable Network Analysis Algorithms • Developer APIs
In-memory Analytics Engine – Product Packaging Oracle Big Data Spatial and Graph Oracle Spatial and Graph (DB option) Available with Oracle 12.2 (EE) Using tables for graph persistence In-database graph analytics Sparsification, shortest path, page rank, triangle counting, WCC, sub graph generation… SQL queries possible Integration with Spatial, Text, Label Security, RDF Views, etc. • Available for Big Data platform • Hadoop, HBase, Oracle NoSQL • Supported both on BDA and commodity hardware • CDH and Hortonworks • Database connectivity through Big Data Connectors or Big Data SQL • Included in Big Data Cloud Service
Architecture of Property Graph REST/Web Service APIs Java, Groovy, Python, … Graph Analytics Parallel In-Memory Graph Analytics Property Graph formats Graph Store Management GraphML GML Graph-SON Flat Files Blueprints/Tinkerpop/Gremlin RDF (RDF/XML, N-Triples, N-Quads, TriG,N3,JSON) Scalable and Persistent Storage Management Oracle RDBMS Apache HBase Oracle NoSQL Database
Creating a Graph • From a relational model • Rows in tables usually become vertices • Columns become properties on vertices • Relationships become edges • Join tables in n:m relations are transformed into relationships, columns become properties on edges • Interactively through API or graphical tool • Adding vertices, edges, properties to a given graph • From graph exchange formats • GraphML, GraphSON, GML (Graph Modeling Language)
Creating a Graph from Network Traffic • Capture network traffic (source/target IP address and port, protocol, state, duration, ...) • Model each IP address as vertex • Model each record (from source IP to destination IP) as an edge • Attributes can become properties on the edge • Utilities available to convert CSV to graph • OraclePropertyGraphUtilsBase.convertCSV2OPV • OraclePropertyGraphUtilsBase.convertCSV2OPE
Agenda Introduction to graph analysis Using Oracle‘s graph technologies to work with graphs Combining graph analysis and machine learning Using machine learning for network intrusion detection Wrap-up 1 2 3 4 5
Combining Graph Analytics and Machine Learning Graph Analytics Machine Learning Build predictive modelusing graph metric Build model(s) and score or classify data • Compute graph metric(s) • Explore graph or computenew metrics using ML result Add to structured data Add to graph
Using Oracle R Enterprise for Machine Learning Use Oracle Database as a high performance compute environment Transparency layer Leverage proxy objects (ore.frames) - data remains in the database Overload R functions that translate functionality to SQL Use standard R syntax to manipulate database data Parallel, distributed ML algorithms Scalability and performance Exposes in-database machine learning algorithms from ODM Additional R-based algorithms executing and database server Embedded R execution Store and invoke R scripts in Oracle Database Data-parallel, task-parallel, and non-parallel execution Invoke R scripts at Oracle Database server from R or SQL Use open source CRAN packages SQL Interfaces R Client SQL*Plus,SQLDeveloper, … Oracle R Enterprise Oracle Database Database ServerMachine In-dbstats User tables
One option: OAAgraph integration with R • OAAgraph integrates in-memory engine into ORE and ORAAH • Adds powerful graph analytics and querying capabilities to existing analytical and machine learning portfolio of ORE and ORAAH • Built-in algorithms of PGX available as R functions • PGQL pattern matching • Concept of “cursor” allows browsing of in-memory analytical results using R data structures (R data frame), allows further client-side processing in R • Exporting data back to Database / Spark allows persistence of results and further processing using existing ORE and ORAAH analytical functions
OAAgraph Architecture • OAAgraph gives remote control of PGX server • PGX loads graph from database (ore.frames) PGX Server (Spatial and Graph) R Client ORE OAAgraph Oracle Database Client • OAAgraph is an additional R package that comes with ORE Database Server
OAAgraph Architecture • OAAgraph gives remote control of PGX server • PGX loads graph via SPARK data frames PGX Server (Big Data Spatial & Graph) R Client Hadoop & Spark ORAAH OAAgraph Client HDFS / Hive / … • OAAgraph is also available with ORAAH Oracle Big Data (Hadoop) Cluster
Execution Overview (ORE) • Initialization and Connection PGX Server R Client ORE OAAgraph Oracle Database Client # Connect R client to # Oracle Database using ORE R> ore.connect(..) R> oaa.init(..) Database Server # Connect to PGX server # using OAAgraph R> oaa.graphConnect(...)
Execution Overview (ORE) • Data Source • Graph data is represented as two tables • Nodes and Edges • Multiple graphs can be stored in database • Using user-specified, unique table names PGX Server Oracle Database Node Table Edge Table node edge node edge Database Server
Execution Overview (ORE) • Loading Graph PGX Server R Client ORE OAAgraph Oracle Database Client node edge # Load graph into PGX: # Graph load happens at the server side. # Returns OAAgraph object, which is a # proxy (remote handle) for the graph in PGX R> mygraph <- oaa.graph (NodeTable, EdgeTable, ...) Database Server
Execution Overview (ORE) • Running Graph Algorithm PGX Server R Client ORE OAAgraph Oracle Database Client # e.g. compute Pagerank for every node in the graph # Execution occurs in PGX server side R> result1<- pagerank (mygraph, ... ) Database Server
Execution Overview (ORE) • Iterating remote values with cursor pagerank PGX Server R Client ORE OAAgraph Oracle Database Client # e.g. compute Pagerank for every node in the graph # Execution occurs in PGX server side R> result1<- pagerank (mygraph, ... ) # Return value is a “cursor” object # for the computed result: # client can get local data frames by oaa.next() R> df <- oaa.next(result1, 10) Database Server
Execution Overview (ORE) w y x 0.01 • Querying the graph 0.2 0.05 z R Client 0.001 PGX Server ORE OAAgraph Client Oracle Database # Query graph using a SQL syntax pattern specification R> q_result <- oaa.cursor(mygraph, “SELECT n.name, m.name, n.pagerank, m.pagerank WHERE (n WITH pagerank < 0.1) -> (m), n.pagerank > m.pagerank ORDER BY n.pagerank” ) # Returns a cursor to examine results R> df <- oaa.next(q_result, 10) Database Server
Execution Overview (ORE) • Exporting the result to DB PGX Server R Client ORE OAAgraph Oracle Database Client node edge # Export result to DB as Table(s) R> oaa.create(mygraph, nodeTableName = “node”, nodeProperties = c(“pagerank“, … ), … ) Database Server
Execution Overview (ORE) • Continuing analysis with ORE PGX Server R Client ORE OAAgraph Oracle Database Client node edge # Use ORE Machine Learning on # the exported table proxy object ore.frames R> model <- ore.odmKMmeans(formula = ~., data = NODES, num.centers = 5,…) R> scores <- predict(model, NODES, …) … Database Server
Agenda Introduction to graph analysis Using Oracle‘s graph technologies to work with graphs Combining graph analysis and machine learning Using machine learning for network intrusion detection Wrap-up 1 2 3 4 5
Use case: Network Intrusion Detection Using deep learning and graph analysis Determining if network activity is legitimate or fraudulent Based on sequence of network activity (as above) Complementary to firewalls, network intrusion prevention system, ... Possible approaches „Signature-based“, using labeled dataset of known attacks (supervised learning) Anomaly-based, trying to detect previously unseen attacks Most effective systems make use of both Combined with rules engine Tested supervised learning in project using DL4J
Supervised learning Training dataset Labeled Network data set from Univ. of South Wales UNSW-NB15 data set specifically created for Network Intrusion Detectionsystems Generated by IXIA PerfectStorm tool in Cyber Range Lab of Australian Centre for Cyber Security Real modern normal activities plus synthetic contemporary attack behaviours Partitioned into training set (175K records) and testing set (82K records) nine types of attacks – Fuzzers, Analysis, Backdoors, DoS, Exploits, Generic, Reconnaissance, Shellcode and Worms Moustafa, Nour, and Jill Slay. "UNSW-NB15: a comprehensive data set for network intrusion detection systems (UNSW-NB15 network data set)."Military Communications and Information Systems Conference (MilCIS), 2015. IEEE, 2015. Moustafa, Nour, and Jill Slay. "The evaluation of Network Anomaly Detection Systems: Statistical analysis of the UNSW-NB15 data set and the comparison with the KDD99 data set." Information Security Journal: A Global Perspective (2016): 1-14.
Prototype with Skymind and DeepLearning4J Graph Database (BDSG and Oracle Spatial and Graph) Graph Database (BDSG and Oracle Spatial and Graph)
Processing Workflow • Understanding the dataset • 49 features in each record – IP addresses, integer, float, timestamp, ... • Data cleansing • Converting Hex to number • Creating vector as input to DL4J deep learning engine • Categorical to One Hot transformation of status strings • Build Neural Network • Train and subsequently test quality using testing set • Transfer result to graph database • Further analysis
Load Property Graph into BDSG Data Cleansing & preparation Dataset selection Graph Visualization Train Neural Network model Generate Property Graph • Understand the data • Features of UNSW-NB15 data set 49 original features
Load Property Graph into BDSG Data Cleansing & preparation Dataset selection Graph Visualization Train Neural Network model Generate Property Graph • One round of clean up. • Ports should be all integer based, however, there are Hex values • Action: convert them back to decimal
Load Property Graph into BDSG Data Cleansing & preparation Dataset selection Graph Visualization Train Neural Network model Generate Property Graph • Understand the data & define transformations • Service “dns” becomes 0 1 0 0 0 0 0 0 0 0 0 0 0 Categorical to One Hot transformation
Load Property Graph into BDSG Data Cleansing & preparation Dataset selection Graph Visualization Train Neural Network model Generate Property Graph • Executed transformations with Scala & Apache Spark using Oracle’s Big Data stack • Save the RDD back to CSV format
Load Property Graph into BDSG Data Cleansing & preparation Dataset selection Graph Visualization Train Neural Network model Generate Property Graph • Built a Multi-Layer Perceptron (MLP) Neural Network
Load Property Graph into BDSG Data Cleansing & preparation Dataset selection Graph Visualization Train Neural Network model Generate Property Graph • Tested the quality of MLP NN • After 800 iterations of training • Accuracy: 0.9811 • Precision: 0.9894 • Recall: 0.9286 • F1 Score: 0.958 • Labeled as “non-intrusion” classified as “non-intrusion”: 46 times • Labeled as “intrusion” classified as “non-intrusion”: 1 time • Labeled as “intrusion” classified as “intrusion”: 6 times ((46+6)/(46+6+1) = 0.9811) • Long Short-Term Memory (LSTM) NN gave similar F1 result
Load Property Graph into BDSG Data Cleansing & preparation Dataset selection Graph Visualization Train Neural Network model Generate Property Graph • Network Intrusion Detection • Property Graph • Blue edges: malicious • Other edges: normal traffic • Many attacks originated from • 175.45.176.1 to target • 149.171.126.17 • Visualization tool: Cytoscape v3.2.1 • + Big Data Spatial and Graph v2.1
Load Property Graph into BDSG Data Cleansing & preparation Dataset selection Graph Visualization Train Neural Network model Generate Property Graph • Focused on “Attacks” graph
Load Property Graph into BDSG Data Cleansing & preparation Dataset selection Graph Visualization Train Neural Network model Generate Property Graph • Focused on “Attacks” graph
Load Property Graph into BDSG Data Cleansing & preparation Dataset selection Graph Visualization Train Neural Network model Generate Property Graph • Focused on “Attacks” graph • Applied built-in analytics in BDSG • Found top-3 IP addresses with highest Page Rank value
Summary Graph analytics and machine learning Graph databases are powerful tools, complementing machine learning technologies Especially strong for analysis of graph topology and multi-hop relationships Graph analytics offer new insight which can be used as input to machine learning Especially relationships, dependencies and behavioural patterns Oracle Big Data Spatial and Graph and Oracle 12.2 Spatial and Graph offer Comprehensive analytics through various APIs Scaleable, parallel in-memory processing about 50 graph algorithms pre-built Integration with R, integration with SPARK, integration with relational database Secure and scaleable graph storage on Hadoop using Oracle NoSQL or HBase or Oracle database Running both on-premise or in the Cloud
Resources • Oracle Big Data Spatial and Graph OTN product page:www.oracle.com/technetwork/database/database-technologies/bigdata-spatialandgraph • White papers, software downloads, documentation and videos • Oracle Big Data Lite Virtual Machine - a free sandbox to get started: www.oracle.com/technetwork/database/bigdata-appliance/oracle-bigdatalite-2104726.html • Hands On Lab included in /opt/oracle/oracle-spatial-graph/ • Content also available on GITHub under http://github.com/oracle/BigDataLite/ • Blog – examples, tips & tricks: blogs.oracle.com/bigdataspatialgraph • @OracleBigData, @SpatialHannes, @agodfrin, @JeanIhm • Oracle Spatial and Graph Group
Interested in project experience, best practices, networking? Spatial and Graph Summit IOUG Business Intelligence, Warehousing and Analytics SIG have established annual BIWA Summit Rebranded as Analytics and Data Summit Planned for March 12 – 14, 2019 at OracleHQ Spatial and Graph Summit is separate track Lots of interesting material from previousyears available on OTN Opportunity for interaction withSpatial PM and Dev‘t team