Download
1 / 10
100 likes | 223 Views
The Modeling Process. Frame the problem Diagram the problem Influence charts Build a model Analyze for insights. Problem Framing. What’s included, what’s excluded? What can we assume? What do we know? What are our objectives? What are our decisions or options?

E N D
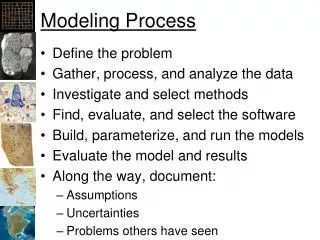
The Modeling Process • Frame the problem • Diagram the problem • Influence charts • Build a model • Analyze for insights
Problem Framing • What’s included, what’s excluded? • What can we assume? • What do we know? • What are our objectives? • What are our decisions or options? • What are the constraints?
Example Problem 1 • Determine the price we should set for our product so as to generate the highest possible profit this coming year.
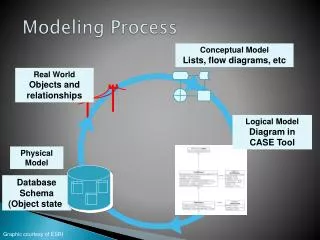
Influence Charts • Use to break through modeler’s block • Help organize the approach to modeling • Begin model documentation • Picture the connections between the exogenous variables and a performance measure without defining the math logic
To Create an Influence Diagram • Pick a performance measure • Decompose the performance measure variable into two or more intermediate variables • Decompose each intermediate variable into more intermediate variables until exogenous variables are defined
Model Building: Spreadsheet Design Guidelines • When organizing the data, common input variables should be presented together and labeled • Model results should be clearly labeled and emphasized • Physical results should be separated from the financial results • Units of measure should be documented where appropriate • Figure 3.16 of text
Model Documentation • Do not embed constants; Place at top of worksheets with appropriate labels and color shading • Attach cell notes • Use text boxes • Use range names
National Leasing: Your Assignment • Refer to the National Leasing, Inc. case posted in Blackboard’s Course Document section • Management at NLI would like to know how best to set residual values on automobile leases. • Can a modeling approach help?
National Leasing: Framing the problem • Model a portfolio of leases or a single lease? • How to model market share? • How to model consumer behavior at lease end? • Include uncertainty or not? • Optimize or simulate?