Download
1 / 1
10 likes | 100 Views
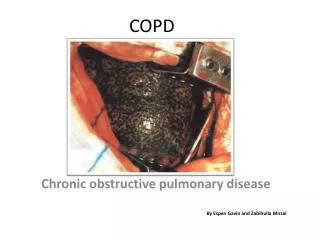
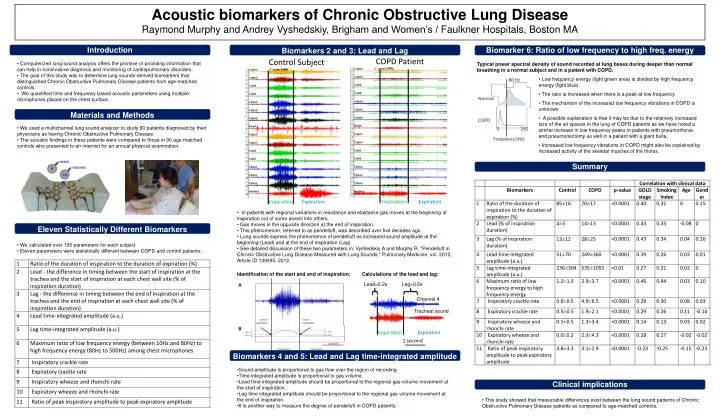
Control Subject. COPD Patient. Acoustic biomarkers of Chronic Obstructive Lung Disease Raymond Murphy and Andrey Vyshedskiy, Brigham and Women’s / Faulkner Hospitals, Boston MA. Lead=0.2s . Lag=0.6s. Channel 4 . Tracheal sound. Introduction.

E N D
Control Subject COPD Patient Acoustic biomarkers of Chronic Obstructive Lung Disease Raymond Murphy and Andrey Vyshedskiy, Brigham and Women’s / Faulkner Hospitals, Boston MA Lead=0.2s Lag=0.6s Channel 4 Tracheal sound Introduction • Computerized lung sound analysis offers the promise of providing information that can help in noninvasive diagnosis and monitoring of cardiopulmonary disorders. • The goal of this study was to determine lung sounds-derived biomarkers that distinguished Chronic Obstructive Pulmonary Disease patients from age-matched controls. • We quantified time and frequency based acoustic parameters using multiple microphones placed on the chest surface . Typical power spectral density of sound recorded at lung bases during deeper than normal breathing in a normal subject and in a patient with COPD. Inspiration Expiration 1 second • Low frequency energy (light green area) is divided by high frequency energy (light blue). • The ratio is increased when there is a peak at low frequency. • The mechanism of the increased low frequency vibrations in COPD is unknown. • A possible explanation is that it may be due to the relatively increased size of the air spaces in the lung of COPD patients as we have noted a similar increase in low frequency peaks in patients with pneumothorax and pneumonectomy as well in a patient with a giant bulla. • Increased low frequency vibrations in COPD might also be explained by increased activity of the skeletal muscles of the thorax. • We used a multichannel lung sound analyzer to study 90 patients diagnosed by their physicians as having Chronic Obstructive Pulmonary Disease. • The acoustic findings in these patients were compared to those in 90 age matched controls who presented to an internist for an annual physical examination. Eleven Statistically Different Biomarkers Biomarkers 2 and 3: Lead and Lag Biomarkers 4 and 5: Lead and Lag time-integrated amplitude Materials and Methods Inspiration Expiration Inspiration Expiration Clinical implications Summary Biomarker 6: Ratio of low frequency to high freq. energy • In patients with regional variations in resistance and elastance gas moves at the beginning of inspiration out of some alveoli into others. • Gas moves in the opposite direction at the end of inspiration. • This phenomenon, referred to as pendelluft, was described over five decades ago. • Lung sounds express the phenomenon of pendelluft as increased sound amplitude at the beginning (Lead) and at the end of inspiration (Lag). • See detailed discussion of these two parameters in: Vyshedskiy A and Murphy R, "Pendelluft in Chronic Obstructive Lung Disease Measured with Lung Sounds," Pulmonary Medicine, vol. 2012, Article ID 139395, 2012. • We calculated over 100 parameters for each subject. • Eleven parameters were statistically different between COPD and control patients: Identification of the start and end of inspiration: Calculations of the lead and lag: • Sound amplitude is proportional to gas flow over the region of recording. • Time integrated amplitude is proportional to gas volume. • Lead time integrated amplitude should be proportional to the regional gas volume movement at the start of inspiration. • Lag time integrated amplitude should be proportional to the regional gas volume movement at the end of inspiration. • It is another way to measure the degree of pendelluft in COPD patients. • This study showed that measurable differences exist between the lung sound patterns of Chronic Obstructive Pulmonary Disease patients as compared to age-matched controls.