Download
1 / 21
210 likes | 368 Views
Evaluation of the Yield Potential Based NFOA for Cotton. D. Brian Arnall Oklahoma State University W. Raun, J. Solie, M. Stone, R. Taylor, J.C. Banks O. Walsh, D. Edmonds, C. Daft, B. England, Y. Kanke, B. Desta. Sensor Based Nitrogen Rate Calculator. What is needed. Yield Prediction Model

E N D
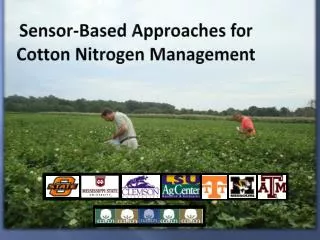
Evaluation of the Yield Potential Based NFOA for Cotton D. Brian Arnall Oklahoma State University W. Raun, J. Solie, M. Stone, R. Taylor, J.C. BanksO. Walsh, D. Edmonds, C. Daft, B. England,Y. Kanke, B. Desta
Sensor Based Nitrogen Rate Calculator What is needed. • Yield Prediction Model • Response Index • Nitrogen Removal • Nitrogen Use Efficiency. • N Rate = (YP0 * RI – YP0) * %N / Efficiency
The Experimental Sites • 2006 • 1 Site: Lake Carl Blackwell (LCB) • 2-4.D • Late Season Stress • 2007 • 3 sites: LCB YP, Altus 439, and Altus N study • NDVI collected over and between rows • 2008 • 4 sites: LCB Irrigated YP, LCB Dryland N study, Altus 439, and Altus N study
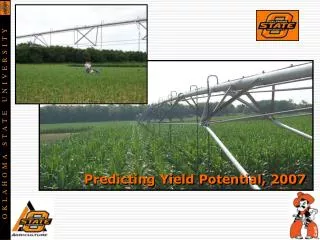
Yield Potential Model • Why use YP. • Nitrogen is a model nutrient and according to Bray need is yield dependent. • Using NDVI as a function of GDD. • Days from Planting or Cumulative GDD
Yield Potential Model Winter Wheat Units: biomass, kg/ha/day, where GDD>0
INSEY DFP Relationship between in season estimate of yield (INSEY) computed from NDVI readings of cotton collected between 60-80 days after planting, divided by the number of days of planting to sensing, and measured lint yield from all site years. Where YP0 = yield potential; YP0 calculated = the mean + one standard deviation.
INSEY Cum GDD Relationship between in season estimate of yield (Cum INSEY) computed from NDVI readings of cotton at growth stages from square to peak bloom (800-1300 Cumm GDD), divided by the number of days of planting to sensing, and measured lint yield from all site years. Where YP0 = yield potential; YP0 calculated = the mean + one standard deviation
NDVI Over Time The trend of NDVI values as days from planting to sensing increases.
Response Index • Dr. Johnson • Response to added fertilizer nitrogen • RINDVI • NDVI of the N-Rich Strip / Farmer Practice • RIHarvest • Yield of the N-Rich Strip / Farmer Practice
RI Harvest and RI NDVI Relationship between the response index measured in season, (NDVI of fertilized plot / NDVI of check plot) from readings of cotton at growth stages from 60 to 80 days after planting, and measured lint yield and the response index measured at harvest (yield of fertilized plot / yield of check plot) from all site years.
Nitrogen Use and Uptake • Research from different parts of the Cotton Belt suggests that high-yielding cotton crops contain about 50-55 lbs. N/bale • (Basset et al., 1970; Mullins & Burmester, 1990; Unruh and Silvertooth, 1996). Cotton Corp • OSU Recommends 27 kg / bale (60 lbs N) • Equivalent to .125 kg N / kg Lint, 12.5%
N Components • If all plant components are accounted for in the algorithm, this results in 146.39 g N kg-1 lint (70.267 lbs N bale-1). • Higher than the values recorded as optimum N rates for cotton grown in Oklahoma of 83.0 g N kg-1 lint. The • Girma et al. (2007a) data closely fit the value of 90 g N kg-1 lint which was calculated from removal of lint and seed. • Not known if using the N content of only the lint and seed is adequate • Or if it will be necessary burs, leaves or stems.
Nitrogen Use and Uptake • Maximum N uptake occurred between 49 and 71 days after planting and was 2.9 and 4.3 kg ha-1 day-1 for cotton receiving 84 and 168 kg N ha-1, respectively. • Boquet, D.J., and G.A. Breitenbeck. 2000. Nitrogen rate effect on partitioning of nitrogen and dry matter by cotton. Crop. Sci., Vol 40 pg 1685-1693 • Very little literature. • NUE of 50%.
SBNRC Algorithm • N Rate = (YP0 * RI – YP0) * %N / NUE • potential cotton lint yield, kg/ha = 235.96 e 2216.2 * INSEY • cotton lint yield, kg/ha = 177.41 e 2216.2 * INSEY • Where: • YP0 = 235.96 e 2216.2 * INSEY • RI = 1.8579 * RINDVI – 0.932 • %N = 0.09 • NUE = 0.50
The Unknown • Can Cotton “Catch-up” once it is behind? • What should the level of preplant N be? • What is the application window? • Plant Growth Regulators.
Thank you Any Questions??????