Enhancing Economic and Social Well-Being in Providence, RI: A Community-Focused Approach
230 likes | 337 Views
ProvPlan, a 501(c)3 non-profit founded in 1992, is dedicated to promoting the economic and social well-being of Providence and its neighborhoods through public/private partnerships. With a strong focus on data analysis, GIS, and web technology, ProvPlan acts as an information intermediary and community convener. Key initiatives include programs like Ready to Learn Providence and YouthBuild, addressing community concerns such as education, employment, and public safety. As the fastest-growing city in New England, Providence seeks to connect people with vital information for a thriving city.

Enhancing Economic and Social Well-Being in Providence, RI: A Community-Focused Approach
E N D
Presentation Transcript
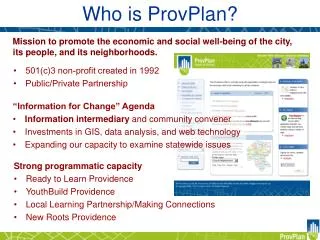
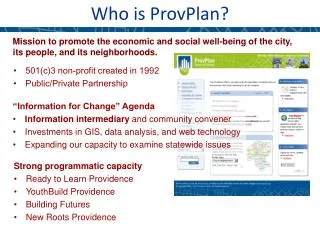
Mission to promote the economic and social well-being of the city, its people, and its neighborhoods. • 501(c)3 non-profit created in 1992 • Public/Private Partnership Who is ProvPlan? • “Information for Change” Agenda • Information intermediary and community convener • Investments in GIS, data analysis, and web technology • Expanding our capacity to examine statewide issues • Strong programmatic capacity • Ready to Learn Providence • YouthBuild Providence • Building Futures • New Roots Providence
Linking people information with place information NEIGHBORHOODS WARDS • Demographics • Jobs/Employment CITY • Property/Land Use CENSUS • Education POLICE POSTS • Public Health PARCEL • Public Safety • Quality of Life
Providence grew, became more diverse, and became younger from 1990 to 2000 • The city grew by 8%, the state only by 4.5%. • Fastest growing city in New England • Minority pop. increased 65% – City 45% non-Hispanic White. • Hispanic growth – Population doubled since 1990 up to 30% of city. • City had 17% overall state pop. – and 50% of state minority pop. • 1 in 4 people in city under 18 – 11% increase since 1990. • Under 18 population was 75% minority – and 45% Hispanic.
Population Change by Neighborhood, 1990-2000 as Percent of Neighborhood Population Providence, RI Neighborhood Pop. 1990 - 2000 Total Growth: 12,890 Source: U.S. Census 1990, 2000 Redistricting Data
Change in Hispanic Population by Neighborhood, 1990-2000 as Percent of 1990 Neighborhood Hispanic Population Providence, RI Hispanic Pop. 1990 - 2000 Citywide Hispanic Population Change: 27,164 Source: U.S. Census 1990, 2000 Redistricting Data
Change in Non-Hispanic White Population by Neighborhood, 1990-2000 as % of 1990 Neighborhood Non-Hispanic White Population Providence, RI N.H.White Pop. 1990 - 2000 Non-Hispanic White Population Change: -24,324 Source: U.S. Census 1990, 2000 Redistricting Data
Change in Black/African American Population by Neighborhood, 1990-2000 as Percent of 1990 Neighborhood Black/African American Population Providence, RI Black/AA Pop. 1990 - 2000 Black/African American Population Change: 1,415 Source: U.S. Census 1990, 2000 Redistricting Data
High School Graduate or Higher, 2000Providence, RI Neighborhoods City rate: 65.8% State rate: 78% Universe: Population over 25 years. Source: Census 2000 SF3
Median Family Income in Providence, 2000 City: $32,058 State: $54,781 From 1990 to 2000: Incomes in Providence grew 2.5 times slower than the state rate. When adjusted for inflation, median family income in the city actually decreased by 6%. Providence has the largest concentration of both low-income and high-income families in RI. 40% of children in the city live in poverty (3rd highest in the nation). Child poverty rate in RI is 17%. Numbers on map indicate median family income for block groups rounded to nearest $1,000. *Current Figures:City: $42,392 State: $68,740 Source: Census 2000 SF3 *American Community Survey 2005-2007 3-year estimate
Unemployment in Providence Current City rate:15.3%*Current State rate:12.8%* In 2000 half the city’s neighborhoods have areas of unemployment 20% or higher. RI has the lowest rate of functional adult literacy according to a recent study. Between 1994 and 2001 only 1 in 5 new jobs in RI were located in Providence. Numbers on map indicate percent of civilian labor force unemployed for block groups. Source: Census 2000 SF3 *RI Department of Labor and Training, 2009
Now Providence continues to gain diversity, but population growth since 2000 is flat • The city’s population has fluctuated modestly in the last few years. • Minority pop. increased 5% – City now 41% non-Hispanic White. • Hispanic growth – Share of pop up 6% since 2000, now 36% of city. • City has 16% overall state pop. – and 45% of state minority pop. • 1 in 3 people in city under 20 – 3.2% decrease since 2000. • Source: 2000 Census and 2007 American Community Survey 3-year estimate
2007 Racial and Ethnic Breakdown Providence, RI Note: All Hispanic regardless of race grouped in Hispanic category The Providence Plan Source: American Community Survey
EDUCATION Providence suffers from low student achievement, significant student mobility, and a high dropout rate. • 22 of 46 schools were in need of improvement as ofSchool Year 2007-08; none were high performing • 16 schools were improving or making progress, but almost twice as many (30) showed insufficient progress. • The district had a SY2007-08 school mobility rate of 28% compared to 16% statewide. • The district had a SY2008-09 dropout rate of 26% compared to 15.5% statewide.
“The Housing Scene” • Assessment values increased 47% between ~2001 and 2004 (revaluation occurring this year).Now sale prices are declining • Vacancy rate increased- 8.1% to 14.4% (2000 to 2007) Highest concentration of vacancy in high-minority neighborhoods • Home ownership rates remain low and stagnant City rate is 34%. RI rate is 60%, and the national rate is 66%. • Lead levels experience steady decline Incidences of lead poisoning for children under six declined from 35% in 1995 to 5% in 2006. RI had 2% cases in 2006.
Real Estate Since 2000 • 638 new residential units between Jun ‘06 and Sep ‘08 • Citywide median residential sales price more than tripled between 2000 and 2005 but is now in decline • Risk of foreclosures, subprime lending, and long waiting lists for public housing remain.
The East Side remains the most expensive neighborhood to rent, but a two-bedroom anywhere in the city will cost at least $1000, according to the 2008 Year End Rent Survey conducted by RI Housing. 2008 Advertized Rents by Neighborhood Source: RI Housing
Married-couple family • With related children under 18 years Source: 2007 American Community Survey
Median Family Income – 2007 Dollars (Adjusted for Inflation) +5.5% vs 1999 -0.2% vs 1989 +5.3% vs 1989 +4.7% vs 1999 -16.2% vs 1989 -12.2 % vs 1989 1989 1999 2007 1989 1999 2007 Sources: 1990 & 2000 US Censuses, 2007 American Community Survey, Bureau of Labor Statistics Consumer Price Index
www.provplan.org Thank you for your time. This information and much more is available on our website: