Download
1 / 41
410 likes | 599 Views
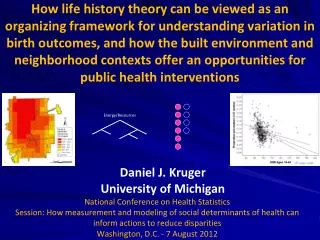
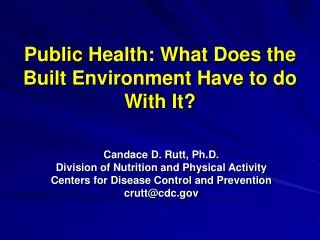
Public Health: What Does the Built Environment Have to do With It?. Candace D. Rutt, Ph.D. Division of Nutrition and Physical Activity Centers for Disease Control and Prevention crutt@cdc.gov. What is the “Built Environment”?. Pretty much everything Buildings

E N D
Public Health: What Does the Built Environment Have to do With It? Candace D. Rutt, Ph.D. Division of Nutrition and Physical Activity Centers for Disease Control and Prevention crutt@cdc.gov
What is the “Built Environment”? • Pretty much everything • Buildings • Size, type, function, aesthetics, density • Transportation systems • Highways, roads, bike lanes, transit, sidewalks • Greenspace • Parks, undeveloped land
Built Environment 101: Learning to Talk the Talk • Density • The number of people either residing or working in an area • Land-use • The degree to which different types of activities (i.e., residential, commercial, business) exist together within a specific area
Built Environment 101: Learning to Talk the Talk • Connectivity - How well pedestrian facilities are connected - Speed and volume of automobile traffic - Wideness and condition of sidewalks - Number of intersections
Urban Sprawl/Suburbia Low density, low land-use, low connectivity, auto dependent with poor pedestrian and transit infrastructure
Traditional Neighborhood/Smart Growth High density, high land-use mix, high connectivity, and has more transportation choices
Why Should We Care About It? • The way we build our cities, communities and neighborhoods affects our health and the environment • Air pollution • Noise pollution • Water pollution • Greenspace
Additional Consequences • Physical activity • Food environment • Obesity • Mental health • Crime • Social Capital • Accessibility • Injury • Transportation
….And It’s Happening in Your Backyard Source: Atlanta Journal-Constitution, March 10, 2006
Air Pollution • In 1997, vehicles accounted for: • 58% of CO • 30% of NOx • 27% of VOCs • 9% of PM • A study in Austria, France, and Switzerland found that automobile related pollution was responsible for more deaths than traffic accidents (WHO, 2001)
Pollution • During the 1996 games in Atlanta there was a 22% decline in traffic counts, a 28% decline in daily ozone levels, and a 41% decrease in acute asthma care events (Friedman et al., 2001)
Water Pollution • Increased impervious surfaces reduces the land’s ability to filter water • Consequently: • Surface water quality declines • Ground water supply is reduced • Land becomes more prone to flooding
Greenspace • Growth affects greenspace which has been linked to physical activity, safety, attentional restoration, productivity, happiness, social ties and sense of community, aggression, stress, and mortality
Social Capital • Living in walkable mixed-use communities was found to be related to higher levels of social capital(Leyden, 2003) • Each additional 10 minutes in daily commuting time cuts involvement in community affairs by 10%(Putnam)
Accessibility • In Houston 3 out of 5 disabled and elderly people did not have sidewalks between their residence and the nearest bus stop • People who do not own a car are not able to participate in social or economic activities
Pedestrian Safety • Only 5% of trips are made on foot but account for 12% of all traffic deaths • For every 1% increase in the sprawl index pedestrian fatality rates fell by 3.56% after adjusting for pedestrian exposure (Ewing et al., 2003)
Pedestrian Safety • Most dangerous roads tend to have: • Multiple lanes • High speeds • No sidewalks • Long distances between crosswalks • Roadways lined with large commercial establishments and apartments(Hanzlick, 1999)
Transportation • The average driver spends 443 hour per year behind the wheel which is about 11 work weeks (Pope, 1999)
Number of miles we drive 25% increase in last 10 years Time we spend in traffic 236% increase since 1982 Money lost in time and fuel $78 billion in 2000 We’re Driving Ourselves Crazy
Transportation • Automobile crashes are the leading case of death for people ages 1 – 24 and cost $200 billion per year (CDC, 1999) • Commuting has been related to back pain, cardiovascular disease, and stress (Koslowsky et al., 1995)
Transportation There was a 51% increase in road rage from 1990 to 1996 (Mizell, 1997)
Nutrition Environment • Availability of food • Portion sizes • More time in automobiles • Preference for convenience foods • Easy access while driving (Berry et al., 1985; Bureau of the Census, 1976; 2000; Center for Science in Public Interest, 2003; Edelman et al., 1986; Policy et al., 1979 Porikos et al., 1982; Rolls et al., 1992; Rolls & Hetherington, 1989)
Nutrition Environment • From 1972 to 1997 the number of fast food restaurants doubled and the number of restaurants rose by 35% (Bureau of the Census, various years) • From 1977 to 1995 there was a 200% increase in the percentage of meals eaten at fast food restaurants(National Restaurant Association, 1998) • A 10% increase in the number of fast food restaurants increases the number of overweight people by 4% and the number of obese people by 7% (Chou, Grossman, & Saffer, 2001)
Nutrition Environment Healthy diets are associated with the availability of supermarkets: (Morland 2002) • Fruit and vegetable intake increases by 32% for each additional supermarket in a census tract for African Americans • Achieving recommended levels of fat and saturated fat among African Americans is also associated with the availability of supermarkets
Nutrition Environment • Portion sizes have also been increasing at fast food restaurants and at home from 1977 to 1996(Nielson & Popkin, 2003)
BAGEL 20 Years Ago Today 140 calories 3-inch diameter How many calories are in this bagel? http://hin.nhlbi.nih.gov/oei_ss/menu.htm#sl2
BAGEL 20 Years Ago Today 140 calories 3-inch diameter 350 calories 6-inch diameter Calorie Difference: 210 calories http://hin.nhlbi.nih.gov/oei_ss/menu.htm#sl2
SPAGHETTI AND MEATBALLS 20 Years Ago Today 500 calories 1 cup spaghetti with sauce and 3 small meatballs How many calories do you think are in today's portion of spaghetti and meatballs? http://hin.nhlbi.nih.gov/oei_ss/menu.htm#sl2
SPAGHETTI AND MEATBALLS 20 Years Ago Today 500 calories 1 cup spaghetti with sauce and 3 small meatballs 1,025 calories 2 cups of pasta with sauce and 3 large meatballs Calorie Difference: 525 calories
TURKEY SANDWICH 20 Years Ago Today 320 calories How many calories are in today’s turkey sandwich? http://hin.nhlbi.nih.gov/oei_ss/menu.htm#sl2
TURKEY SANDWICH 20 Years Ago Today 320 calories 820 calories Calorie Difference: 500 calories http://hin.nhlbi.nih.gov/oei_ss/menu.htm#sl2
Nutrition The average per capita calories consumed increased 550 calories per day from 1970 to 1997 (Bureau of the Census, various years) Just an extra 100 calories a day leads to an extra 10 pounds a year
Physical Activity Environment • Declines across most domains of physical activity • Recreational • Occupational • Household • Transportation • Increase in attractive sedentary activities (James, 1995; McArdle et al., 1997)
Leisure Time Physical Activity • U.S. children between the ages of 2 and 17 spend an average of 3 years of their life watching television(A.C. Nielson Co., 1998) • Children who watch more than 5 hours of TV a day are 5 times more likely to be overweight than children who watch less than 2 hours a day
Household Physical Activity • Decrease in energy expenditure due to “time-saving” devises • lawn mowers • snow blowers • vacuum cleaners • washing machines • microwaves
Transportation Physical Activity • The percentage of trips made by biking and walking in the U.S.dropped from 6.7% in 1980, to 4.4% in 1990, and to 3.3% in 2000 (U.S. Census, 1980, 1990, 2000) • Number of automobiles per household • Individual attitudes and demographics • Changes in the built environment (density, land- use, connectivity)
Obesity • For each 1 point rise in the urban sprawl index (0 – 100) the risk for being overweight increased by 0.2% and the risk for being obese increased by 0.5% (Lopez, 2004) • County sprawl index was associated with minutes walked, BMI and hypertension (Ewing et al., 2003)
Obesity • Each additional hour spent in the car was associated with a 6% increase in the likelihood of obesity (Frank et al., 2004) • Each kilometer walked per day was associated with a 4.8% reduction in the likelihood of obesity (Frank et al., 2004)
So What Can a MCH Professional Do? • Networking • With other health professionals • Within health department • Establish professional relationships with local planners and developers • Advocacy • Educate others • Attend local zoning and planning meetings • Science • Perform research, present at scientific meetings, publish papers
Summary • The way we design and build the places we live, work, and play has an impact on our health • As a public health professional you can have a positive impact on what happens in your neighborhood and community