Tom Stone Research Officer Key Performance Indicators
150 likes | 326 Views
Tom Stone Research Officer Key Performance Indicators. Purpose. Monitor KPI’s identified in economic development strategy Measure impact of economic development strategy moving forward Identify areas of strength and weakness Types of variables Economic measures (income, affordability etc.)

Tom Stone Research Officer Key Performance Indicators
E N D
Presentation Transcript
Tom Stone Research Officer Key Performance Indicators
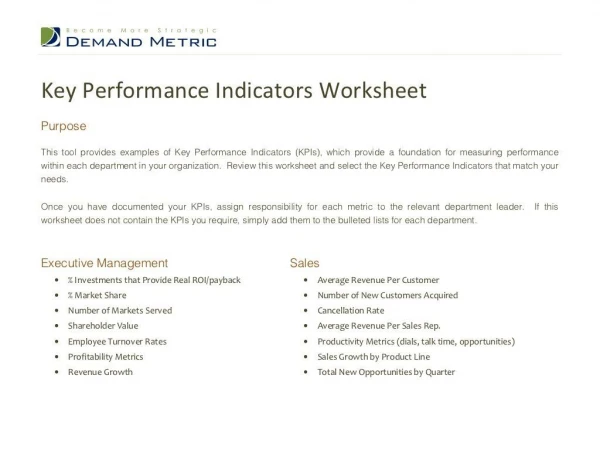
Purpose • Monitor KPI’s identified in economic development strategy • Measure impact of economic development strategy moving forward • Identify areas of strength and weakness • Types of variables • Economic measures (income, affordability etc.) • Demographics, population, unemployment • Investment and business
Methods of measurement • For each KPI, figures have been sought for the past 20 years • Where figures are unavailable is due to • Data not collected over the whole of the period • Technology not available throughout the whole period
Gross local product per capita • Adjusted for inflation to 2007/2008 equivalent • Steady upward trend over the period • Since 2007 trend has flattened, in part likely due to GFC
Population • 20 years of figures show gradual upward long term trend • Approx 1% per annum growth in the past decade • Recent uptrend driven by North Fremantle development
Fremantle labourforce • Census data collection began in 1999 • 23% growth over past decade • Workers residence • Cockburn (20%) • Melville (18%) • Fremantle (16%) • Rockingham (6%) • Canning (5%)
Participation rate • Fremantle participation rate trended toward state average over the period • 2011 figures from different source, showing inflated results • Closing differential between Fremantle and Perth Metropolitan area
Unemployment rate • Steadily falling rate • 2011 likely to see flattening as full employment reached • Reflects both gentrification or Fremantle and broader state trends
Wages • Census figures, adjusted for inflation to 2010 equivalent • Strong upward trend over the period • Increasing affluence in Fremantle • Next census 2011
Mean taxable income • Australian Taxation Office figures, adjusted for inflation to 2010 equivalent • Steady real wage growth in taxable income across the City of Fremantle area
Business and technology • Technology • 36% of residents with access to broadband in 2006 • Expected upward trend in next Census • Monitor in future Business • Estimated 1800 active businesses in Fremantle • 83% of businesses have email • 30% of businesses have a website
Individuals with bachelor degree (or higher) • Long term upward trend • Fremantle above average • Difference is increasing • University of Notre Dame?
Net lettable area and vacancy • 2007 survey figures currently being sought • Slight fall in commercial space over period, looking for reversal in trend • Increase in industrial space, mostly due to O’Connor • Retail space flat
Fremantle business confidence • Profitability & confidence drop during “GFC” • Profits have remained flat, confidence is shaky • RBA has resumed tightening cycle • Next survey due in September
Indicators to monitor in the future • Institutional membership • Fremantle Chamber of Commerce • Experience Perth • Retail and commercial space trends • Housing affordability • Value of non-residential building applications • People employed in research and technical services