Download
1 / 17
170 likes | 309 Views
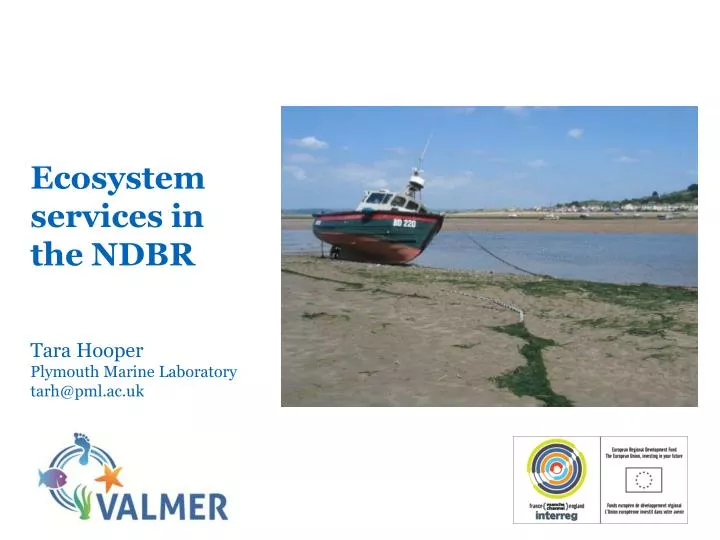
Ecosystem services in the NDBR Tara Hooper Plymouth Marine Laboratory tarh@pml.ac.uk. Using Ecosystem Services in Management. Understand the level of key services delivered by NDBR habitats. Evaluate how service delivery changes under different managemen t scenarios.

E N D
Ecosystem services in the NDBR Tara Hooper Plymouth Marine Laboratory tarh@pml.ac.uk
Using Ecosystem Services in Management Understand the level of key services delivered by NDBR habitats Evaluate how service delivery changes under different management scenarios Compare outcomes and consider trade-offs
Understanding the delivery of key services • Habitat • Service • Benefit • Nursery habitat • Waste processing • Carbon burial
Our approach Step 1 – Literature review What do juvenile fish need? water depth sediment type food sources
Our approach Step 1 – Literature review What species/processes control regulating services? bioturbation: how species rework the substrate
Our approach Step 2 – Local survey data What substrates/species are present? PML (1973) National Museums & Galleries of Wales (2003) RWE (2011) Environment Agency (2008, 2010, 2013) Step 3 – Link to habitat types To allow services to be mapped across the NDBR
Findings Good links between sites and habitats for remediation but….. only where species information is present Links between biological traits and habitats not clear so........ carbon sequestration mapped by just substrate Fisheries species food preferences are too general so........ not included in the assessment and..... mapped by just substrate/depth Hoping for validation through input from fishers
Offshore: Waste remediation To follow…….
Offshore: Nursery habitats • To follow….. • Lobster • Cod • Bass • Skates/rays • Sole/Plaice
Estuary: Nursery habitats • Sole/Plaice • Lobster • Bass • Skates/rays • Cod
Aggregation and trade offs How should we represent the occurrence of multiple services in the same place? What happens when the effects of management interventions occur in opposite directions for different services?
Aggregation and trade offs Just an EXAMPLE – based on equal weighting
Weighting ecosystem services How important are the ecosystem services to you? Please complete the score card • 3 • 0 • 4 • Carbon sequestration • …….. • 3 • 12 • 4 • Remediation of waste • …….. • Nursery habitat • 0 • 6 • 4 • …….. • 12 • TOTAL Ensure your scores add up to 12
Weighting ecosystem services How do you rank the fisheries? • 1 • 1 • 1 • Bass • …….. • 1 • 4 • 3 • Cod • …….. • 1 • 2 • 1 • Lobster • …….. • 1 • 5 • 3 • Sole/plaice • …….. • 1 • 3 • 3 • Skates/rays • …….. Rank 1 – 5 or use equal scores 1 = most important 5 = least important Please also complete the additional questions