Download
1 / 1
10 likes | 181 Views
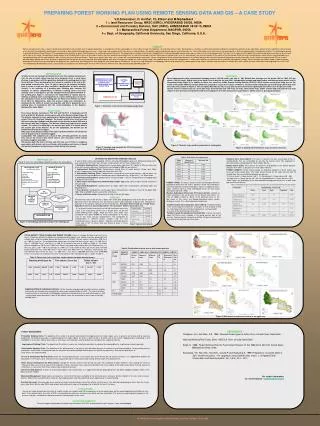
ADMISTRATIVE AND ANCILLARY DATA Compartment map Soil map Slope map Rainfall map Settlements map Transportation netwok map Drainage and water bodies map. REMOTE SENSING DATA Forest type map Forest density map NTF map TIV map Total volume map Timber volume map Stock density map.

E N D
ADMISTRATIVE AND ANCILLARY DATA Compartment map Soil map Slope map Rainfall map Settlements map Transportation netwok map Drainage and water bodies map REMOTE SENSING DATA Forest type map Forest density map NTF map TIV map Total volume map Timber volume map Stock density map GIS ANALYSIS ADMININSTATIVE DATA PHYSIOGRAPHIC DATA CLIMATIC DATA ANTHROPOGENIC DATA FOREST DATA MULTI-CRITERIA ANALYSIS CRITERIA FOR WORKING CIRCLE CRITERIA FOR WORKING CIRCLE DEFINITION WORKING CIRCLES WORKING CIRCLE MANAGEMENT PLAN WORKING PLAN MANAGEMENT PLAN WORKING PLAN PREPARING FOREST WORKING PLAN USING REMOTE SENSING DATA AND GIS – A CASE STUDY V.K.Srivastava¹, D. Anitha², Y.L.P.Rao³ and M.Niphadkar4 1 = land Resources Group, NRSC (ISRO), HYDERABAD 50038, INDIA 2 = Environment and Forestry Division, SAC (ISRO), AHMEDABAD 38 00 15, INDIA 3 = Maharashtra Forest Department, NAGPUR, INDIA 4 = Dept. of Geography, California University, San Diego, California, U.S.A. SUMMARY Forest management in India, is carried out for forest protection, conservation and to regulate production, in accordance with the working plan of a forest division and also helping in soil and water conservation. Working plan is, therefore, a written document describing the management activities to be undertaken subject to forest condition in different part of the division. Conventionally, working plans are based on data collected through ground surveys, stock maps and compartment history forms on crop condition, site quality, edaphic and climatic regime, cultural features etc. These information are used to classify the working plan in different working circles at compartment level. The working plan period is generally between 10 and 15 years. The management prescription as given in working plan is executed at compartment level. The underlying assumption in defining the compartment is that physiographic features and crop are uniform in the whole compartment. This was true to some extent till about half a century ago when pressures on forests were not as high as are today. Compartments today contain lot of variability both in terms of the crop as well as the other conditions prevailing there. In view of the changes that have taken place at compartment level, the working plans are revised regularly at the expiry of the plan period. While revising the working plan, many data as mentioned above are incorporated along with the crop condition. Most of these data are in different formats. Some are in tabular form; others are in maps with varying projections and scales. Hence, integration of all the relevant data becomes very difficult owing to the inherent limitation of integrating such data manually. Use of remote sensing data and GIS has made it possible today to generate all such ormation in graphical domain that can be easily analyzed and integrated with each other. A multi-criteria query can also be made using such graphical data to define the homogeneous / uniform forest patches or working circle for a definite management strategy. Various attempts have been made in India to prepare multitude of the thematic maps required for the purpose from satellite data and integrate the same along with non-spatial data in GIS domain. The present study describes a methodology evolved for preparation of a working plan using various thematic maps derived from satellite data, other spatial and non-spatial data and integrating the same in GIS. The methodology developed has been used to prepare a comprehensive working plan for Pune Forest Division, Maharashtra, India for the period 2004-05 to 2013-14. INTRODUCTION In India, forests are managed at compartment level (the smallest management unit, the size of which varies from few ha to hundreds of ha) in each forest division, in accordance with the guidelines defined in the working plan for that forest division. These working plans are revised or rewritten at the end of the plan period (normally after 10 to 15 years) owing to the existing variability both in terms of crop and other conditions. Identification of forest working circle(s) is the mainstay of a working plan. Working plan contains the locations of various compartments in different working circles and each working circle is managed as per the management prescription identified in the working plan. Figure 1 summarizes the requirement of various data for defining a working circle and preparation of a forest working plan. In view of the scheduled revision of the working plan for Pune forest division for 2004-05 to 2013-14, Maharashtra, India, the present study was undertaken to demonstrate the utility of remote sensing data and GIS in preparation of a working plan, in accordance with the recommendations of the National Working Plan Code (2004). DATA USED Forest administrative data (compartment boundary map at 1:25,000 scale), soil map (1: 1M), Rainfall data (average over the period 1931 to 1960), SOI top sheets (1:50,000 scale), Digital chart of the world, Census data for the year 2001, transportation network and water bodies and drainage maps where used in the present study (Figure 3). In addition to these, four cloud free Indian Remote Sensing Satellite (IRS-1D) LISS-III scenes covering the study area for the month of December 2004 and January 2005 were analyzed to assess the resource conditions. The False Color Composite generated using LISS-III data over the study area is shown in Figure 2. The non-spatial data like rain fall, census data etc were converted to spatial data for further use in the present study. Various resource related maps viz. forest type map, forest density map, NTF map, TIV map, Total volume map, Timber volume map and stock density map (Figure 4) were generated using IRS-ID LISS-III and validated in the field. All data were organized at 1:50,000 scale in a geo spatial database. Figure 1: Schematic of the forest working plan preparation. STUDY AREA Pune forest division lies between 730 18.5’ and 750 07.5’ E longitude and 170 55.5’ and 180 50’ N latitude, on the eastern side of the Western Ghats (Figure 2). The division consists of seven administrative talukas (Indapur, Baramati, Daund, Haveli, Pune city, Paud and Vadgaon). The annual rainfall varies from less than 800 mm eastern part (Indapur and Baramati) of the division to about 5000 mm in the western hilly part (Vadgaon). The division affords dry tropical to per humid climate. The terrain is undulating in the western part while it is almost plain in the eastern part of the division. As per the topography, the division can be divided into three distinct regions. Hilly areas of the Western Ghats: This region stretches between 15 and 30 kms east of Shyadris and is extremely rugged. Central Belt: This comprises of a chain of hills stretching between 16 and 32 kms east of the western belt, which tend to sink into plains where valleys becomes straighter and wider. The eastern belt: this tract stretches upto 144 kms east of Pune. It comprises open plains with barren soil less hillocks with boulders and sheets of basalt that portray bleakness and barrenness except during rainy season. Figure 3: Thematic maps used in preparation of working plan. Figure 2: Location map alongwith the FCC of the district and the Forest division. Figure 4: Satellite derived thematic maps on forest resources. Table 2: Distribution of compartments. CRITERIA FOR IDENTIFYING WORKING CIRCLES: In view of forest status, physiographic, climate, soil and anthropogenic pressure, following working circles were selected for the Pune Forest Division, in consultation with the Forest Department. 1. Protection Working Circle: Compartments having slopes more than 10; a buffer of 20 m on either side of the main streams and heavy rainfall areas (rainfall above 5000 mm per annum). 2. Improvement Working Circle: Compartments having forest of crown density >40 per cent (Open forest); Compartments having moderate slopes (less than 10). 3. Afforestation Working Circle: Compartments having dense forest (crown density > 80 per cent)—for silvicultural thinning; compartments having open forest (crown density < 40 per cent ) – for afforestation. 4. Joint Forest management: Compartments having soil depth > 30 Cm; Compartments having degraded and southern thorn forest. 5. Water source Development for Wild life Water bodies map; Buffer zone of 500 m around settlements and cart roads. 6. Watershed Management: Compartments on slopes above 30; compartments containing open and degraded forest. 7. Fire risk Zone: Compartments having open forest; Compartments having less than 10 soil depth; 500, 1000, 1500 and 2000 m buffers around the settlements. 8. Survey and Demarcation: Compartments lying in low rain fall region. Southern thorn forest (6A/C1): Thisforest is found in the drier eastern part of the, in isolated blanks that are surrounded on all sides by revenue land. The vegetation is characterized by stunted growth of Neem, Babul, Bor etc. METHODOLOGY Figure 5 shows the methodology followed to prepare the working plan. Babool Forest (5/E3): These forests are found in small patches in the alluvial deposits, along the river banks. It occupies an area of about 1072 ha. FOREST DENSITY: Forest density being an important indicator of forest health, was assessed using satellite data. The crown density based on the color intensity onto the satellite data, was classified into following four classes. (1) Dense forest = Crown closure > 60 % (2) Closed forest = Crown closure 40 – 60% (3) Open forest = Crown closure 20 – 40% (4) Degraded forest = Crown closure < 20% Table 3 gives the distribution of the aforementioned canopy density classes in each forest type found in the division. FOREST TYPES: The forests found in the division belong to Western Subtropical Broad leaf Hill Forest, Southern mixed moist deciduous forest and Southern mixed Dry Deciduous Forest. In addition to these types, southern thorn or shrub and Babool forests are also found (Champion and Seth, 1969). Western Subtropical Broad leaf Hill Forest (8A/C2): Located at higher elevation in the western part of the division and covers an area of 3,000 ha (Table 3). Some of the dominant trees in the top storey of this forest are: Mango (Mangifera indica), Jambul (Syzigium cumini), Pisa ( Actinodaphene hookeri) etc. Table 3: Distribution of forest area under each density class in each forest type found in the division. RESULTS The total forest area in the division is about 18% of the total geographical area of the division (Table 1). More than half of the division’s area was found to either under habitation or barren land. Owing to the confusion in the spectral signature of these two classes, they have been treated as a single Class. Agriculture covers an area of about 26 per cent and water bodies about 3 per cent. Southern mixed moist deciduous forest (6A/C3): Distributedwidely in the humid region of the division. It occupies an area of about 16,210 ha. Terminalia tomentosa, Bombax malabaricum, Lannea grandis are some of the dominant top storey trees. Southern mixed dry deciduous forest (6A/C2): It covers an area of about 20,720 ha and is located in the broad western part of the division. Tectona grandis, Anogeissus latifolia, Diospyrosmelanoxylon are some of the dominant top storey trees. It is of interest to note that out of the 146,446 ha of forest area, only a part is the state forest and the rest is private forest. As per the earlier Working Plan (Singh, 1985) the forest area under state jurisdiction was about 69,000 ha, which corresponds to the total area of the entire division compartments. The distribution of compartments in different talukas (ranges) and the total compartment area is given in Table 2. However, during the present study, only 41,321 ha forest area was found to occur in these compartments. Figure 5: methodology followed to prepare the working plan. Table 1: land use in the division. STOCK DENSITY, TREE VOLUME AND TIMBER VOLUME: Unless it is known that how much exist in the forest; it becomes difficult to decide the management plan.Hence, tree volume map was generated from satellite data using the method defined by Srivastava et al (1999). The tree volume varied from <100 Cu m to > 100 Cu m per ha. The estimated tree volume was classified into three classes: class 1 (< 100 Cu m), Class 2 (100-200 Cu m), and Class 3 (> 200 Cu m) found in the area of 4,290 ha (Table 4). The timber volume ranged from <50 Cu m to >100 Cu m. Hence, estimated timber volume was classified into class 1 (< 50 cu m), class 2 (50 – 100 cu m) and class 3 (>100 Cu m). The number of stems per ha was also estimated which varied from less than 200 stems / ha to more than 600 stems ha. Therefore, stock density was classified into four classes viz. class 1 (< 200 stems / ha), class 2 (200-400 stems/ha), class 3(400-600 stems / ha) and class 4 (> 600 ha). The forest area falling in each stock density class is given in Table 4. Table 5: Distribution of forest area in each working circles. Table 4: Forest area ( ha) in each tree, timber volume and stock density classes. IDENTIFICATION OF WORKING CIRCLES: All the thematic maps derived from administrative, ancillary and remote sensing data were integrated to create a geo-spatial data base in GIS. The criteria to define a working circle as mentioned in methodology section were utilized to carry out multi-criteria query in GIS using the geo-spatial data base. Figure 6 and Table 5 shows the distribution of forest each of the eight working circles. Figure 6: Distribution of forest area in each of the eight WCs. REFERENCES Champion, H.J. and Seth, S.K. 1969.Revised Forest types of India, Govt. of India Press, New Delhi, National Working Plan Code, 2004. MOE &F, Govt. of India, New Delhi. Singh, K. 1985. Forest Working Plan for Pune Forest Division for the 1982-83 to 2001-02, Forest Dept., Maharashtra State, India. . Srivastava, V.K. Rai, A.M., Dixit,R.K., Oza,M.P. and Narayana,A. 1999 Preparation of volume table of Sal ( shorea robusta L) – An approach using satellite data. Intern. J. of Applied Earth Observation and Geoinformatics. Vol. 1(3/4), 214 – 221.. FOREST MANAGEMENT Protection Working Circle: Theobjective of this circle is to protect and improve the vegetal cover on steep slopes so as to prevent soil erosion and to conserve biodiversity. No felling of any type is recommended on the slopes above 10º and in a buffer of 20 m on either side of the stream. Digging of pits for planting is also prohibited in such areas. If blank areas exist in such areas, seed sowing is recommended so as to improve the vegetation density. Improvement Working Circle: The objective of this circle is to carry out silvicultural operations to improve the crop condition by singling and cut back operation. Afforestation Working Circle: The objective of this working circle is not only to raise plantation but also to maintain the existing plantations. During maintenance of plantations, small timber is extracted to meet the requirement of the local people and increases the yield of the plantations. Raising new plantations of local species are recommended. Survey & demarcation Working Circle: Since the existing compartments in the eastern part of the division do not contain any forest, it is suggested to redefine the boundaries in these parts. Also, new forest areas acquired during the earlier plan period may be defined under new compartments. Water Source Development for Wild animals: Though the division receives water during monsoon, the availability of water becomes scares during the month of February to May every year for wild animals and birds. Hence, new water holes need to be identified near to the habitat of the wild animals which must be away from settlements, in such areas that remain inaccessible to domestic animals. N Joint Forest Management: In order to involve local people in the maintenance, it is suggested to identify degraded forests with better edaphic conditions within 2 Km proximity of the villages. Watershed Management: Watersheds are treated in a manner that the water availability in the command areas increases and the siltation in the rivers and reservoirs reduces. Watersheds are prioritized for treatment. Raising plantations and improving the present vegetal cover is recommended. Fire Risk Zone map: The vulnerable forest area to fire needs to be identified in view of the criteria set forth earlier. This will help in projecting the forest from fire. Forest cover map, forest density map, DEM, road network and settlements map are the prerequisite to identify the forest risk zones. For further information: Dr. V.K.Srivastava ; vijayks52@gmail.com CONCLUSIONS The present study demonstrates the utility of satellite remote sensing data and GIS in preparation of forest working plan and the need to operational utilization of such data. It also demonstrates the utility of GIS in harmonizing the data base created using spatial and non-spatial data The end to end working plan prepared in the present study was submitted to state government for implementation of the same. ACKNOWLEDGEMENTS Financial support extended by the Organizing Committee,13Th WFC for participation in the Congress is duly acknowledged. 13th World Forestry Congress, Buenos Aires, Argentina, October 18-24, 2009