Download
1 / 16
160 likes | 197 Views
This presentation delves into the performance and promises of the 2016 elections in relation to the Good Governance Index, discussing political dynasties, voter behavior, and provincial governance trends.

E N D
THE 2016 ELECTIONS AND THE GOOD GOVERNANCE INDEX: PERFORMANCE, PROMISES, OR POLITICAL DYNASTIES? By Romulo A. Virola, Kristine Faith S. Agtarap, Priscille C. Villanueva, and Mai Lin C. Villaruel Presented by Mai Lin C. Villaruel
OUTLINE OF PRESENTATION • I. INTRODUCTION • II. FRAMEWORK ON GOOD GOVERNANCE • III. RESULTS – PROVINCIAL GG: 2011 AND 2014 • IV. THE VOTERS’ INDEX • V. POLITICAL DYNASTY AND GOOD GOVERNANCE INDEX • VI. THE WAY FORWARD
I. Introduction How it started? • NSCB initiatives to contribute to the knowledge database on governance: • Development of a Governance Framework in 1998 under the “Development of Governance Indicators and Design of a Database & Information Network on Governance Statistics” supported by the Canadian International Development Agency (CIDA)
I. Introduction Interesting international statistics! Global Competitiveness Index of the Philippines, Rank(World Economic Forum) Corruption Perception Index, by Rank(Transparency International) Number of countries included every year: 139, 142, 144, 148, 144 and 140 in 2010-2011, 2011-2012, 2012-2013, 2013-2014, 2014-2015 and 2015-2016, respectively.
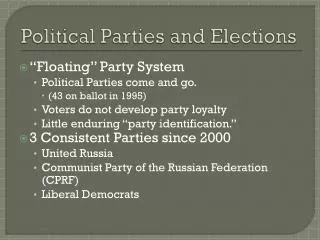
I. Introduction Political Dynasty in the Philippines
II. Framework on Good Governance Framework on Good Governance Political Administrative Economic 1. Sustainable Management of Resources 2. Enhanced Government Responsiveness to the poor • Improvement of internal and external security • 2. Law enforcement and • administration of justice • 3. Elimination of graft and • corruption • Efficiency in the delivery of • services • 2. Improved transparency and • accountability • 3. Continuous building of • capacities • 4. Expanded use of ICT
II. Framework on Good Governance Provincial Good Governance Index (PGGI) • The PGGI is the weighted arithmetic average of the economic governance index (EGI), political governance index (PGI), and the administrative governance index (AGI) Detailed Component Indices EGI = Ave (SMRI, EGRPI) where: SMRI = Ave (Management of Financial Resources Index, Management of Human Resources Index) EGRPI = Ave (Poverty Index, Inflation Rate) AGI = Education Index + Health Index + (Power Index + Telephone Density Index) / 2 3 PGI = Ave (Voters’ Turn-out Rate Index, Crime Solution Efficiency Rate Index22)
III. Results - Provincial GGI: 2011 and 2014 Philippine GGI improved between 2011 and 2014!
III. Results - Provincial GGI: 2011 and 2014 Top 10: 9 from Luzon! 1 from the Visayas! Top 10: 9 from Luzon! 1 from the Visayas! 10 Most Improved: 5 from Luzon 2 from the Visayas 3 from Mindanao 10 Most Deteriorated: 5 from Luzon 2 from the Visayas 3 from Mindanao Note: Rank out of 79 provinces in the Philippines
III. Results - Provincial GGI: 2011 and 2014 8 of the Top 10 Provinces in 2011 GGI are still the top Provinces 2014 GGI
III. Results - Provincial GGI: 2011 and 2014 Note: Rank out of 79 provinces in the Philippines
IV. The Voters’ Index • THE VOTERS’ INDEX • Aims to measure the “wisdom” of the voters in selecting candidates • A rating or grade of “0” or “1” is assigned to a province, depending on the results of the election and their GGI:
IV. The Voters’ Index Provincial Voters’ Index during the 2016 Elections Voters’ index worsened from 2013 to 2016!
V. Political Dynasty and Good Governance Index 9 of the 10 provinces with the lowest share of political dynasty ranked well in 2014 GGI. half of the 10 provinces with the highest prevalence of political dynasty ranked unfavorably (46th-79th) in 2014 GGI
VI. The Way Forward • PSS has role in the measurement and monitoring of good governance. • Compilation of GGI at the municipal and city level • Proper dissemination and advocacy towards public appreciation of GGI • Capacity building for both producers and users of GGI • The government and the private sector must invest in governance statistics!