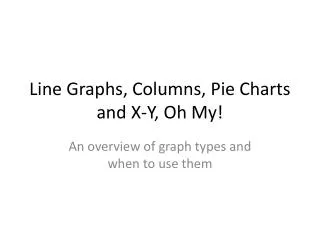
Mastering Line Charts for Trend Analysis
Learn how to analyze trends using line charts in spreadsheet tools. Practice creating line charts to visualize data trends effectively over time. Utilize filters to focus on specific data of interest in OrderInformation.xlsx.

Mastering Line Charts for Trend Analysis
E N D
Presentation Transcript
CSCI N207 Data Analysis Using Spreadsheet 9c. Line Charts Lingma Acheson linglu@iupui.edu Department of Computer and Information Science, IUPUI
Line Charts • Univariate analysis • Data represented as single-valued points. • Data values are on the y-axis. X-axis contains data labels only. • Best used for showing a trend over a given period of time. • Be careful with what you read. Double of 100 will not show at much as double of 2000.
Line Charts • Practice: Use the OrderInformation.xlsx and plot a line chart showing the order trends of two types of coffee. • Can use the Filter feature to hide records of no interest. • OrderInformationLineChart.xlsx