Download
1 / 26
390 likes | 1.04k Views
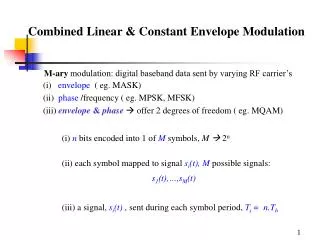
(i) n bits encoded into 1 of M symbols, M 2 n. (ii) each symbol mapped to signal s i (t), M possible signals: s 1 (t),…,s M (t). (iii) a signal, s i (t) , sent during each symbol period, T s = n.T b. Combined Linear & Constant Envelope Modulation.

E N D
(i) n bits encoded into 1 of M symbols, M 2n • (ii) each symbol mapped to signal si(t), M possible signals: • s1(t),…,sM(t) (iii)a signal, si(t) , sent during each symbol period, Ts = n.Tb Combined Linear & Constant Envelope Modulation • M-ary modulation: digital baseband data sent by varying RF carrier’s • (i) envelope ( eg. MASK) • (ii) phase /frequency ( eg. MPSK, MFSK) • (iii) envelope & phase offer 2 degrees of freedom ( eg. MQAM)
Combined Linear & Constant Envelope Modulation • M-ary modulation is useful in bandlimited channels • greater B log2M • significantly higher BER • - smaller distances in constellation • - sensitive to timing jitter • MPSK • MQAM • MFSK • OFDM
Carrier phase takes 1 of M possible values – amplitude constant 2 Ts i= 2(i-1)/M, i = 1,2,…M Modulated waveform: si(t)= 0 t Ts, i = 1,2,…M Es = log2MEb Ts = log2MTb energy per symbol symbol period written in quadrature form as: si(t)= for i = 1,2,…M Mary Phase Shift Keying Basis Signal ?
Orthogonal basis signals defined over 0 t Ts sMPSK(t)= MPSK signal can be expressed as 2(t)= 1(t)= i = 1,2,…M Mary Phase Shift Keying
2(t) 1(t) Mary Phase Shift Keying • MPSK basis has 2 signals 2 dimensional constellation • M-ary message points equally spaced on circle with radius • MPSK is constant envelope when no pulse shaping is used • MPSK signal can be • coherently detected • = Arctan(Y/X) • Minimum | I - | • non-coherent detected • with differential encoding
4 Es No 2M sin 2 Q Mary Phase Shift Keying Probability of symbol error in AWGN channel – using distance between adjacent symbols as Pe= average symbol error probability in AWGN channel Pe When differentially encoded & non-coherently detected, Peestimated for M 4 as: Pe
Ts= Tblog2M • - Ts = symbol duration • - Tb = bit duration Power Spectrum of MPSK Ps(f) = ¼ { Pg(f-fc) + Pg( -f-fc) } PMPSK(f) = PMPSK(f) =
PSD for M = 8 & M = 16 0 -10 -20 -30 -40 -50 -60 normalized PSD (dB) fc-½Rb fc-¼Rb fc fc+¼Rb fc+½Rb fc-⅔Rb fc-⅓Rb fc+⅓Rb fc+⅔Rb rect pulses RCF • Increase in Mwith • Rb held constant • Bnull decreases • Bincreases • denser constellation • higher BER
MPSK Bandwidth Efficiency vs Power Efficiency • B = bandwidth efficiency • Rb = bit rate • Bnull = 1st null bandwidth • Eb/N0 for BER = 10-6 • bandwidth efficiency & power efficiency assume • Ideal Nyquist Pulse Shaping (RC filters) • AWGN channel without timing jitter or fading
Mary Phase Shift Keying • Advantages: • Bandwidth efficiency increases with M • Drawbacks: • Jitter & fading cause large increase in BER as M increases • EMI & multipath alter instantaneous phase of signal • – cause error at detector • Receiver design also impacts BER • Power efficiency reduces for higher M • MPSK in mobile channels require Pilot Symbols or Equalization
si(t)= 0 t Ts i = 1,2,…M Mary- Quadrature Amplitude Modulation • allows amplitude & phase to vary • general form of M-ary QAM signal given by • Emin = energy of signal with lowest amplitude • ai, bi= independent integers related to location of signal point • Ts = symbol period • energy per symbol / distance between adj. symbols isn’t constant • probability of correct symbol detection is not same for all symbols • Pilot tones used to estimate channel effects
Assuming rectangular pulses - basis functions given by 0 t Ts ai1(t) + bi2(t) 0 t Ts si(t) = 0 t Ts i = 1,2,…M 1(t)= 2(t)= Mary- Quadrature Amplitude Modulation QAM signal given by: coordinates of ith message point = and (ai, bi) = element in L2 matrix, where L =
ai1(t) + bi2(t) 1(t) + 2(t) 1(t) + 2(t) {ai,bi} = s11(t) = -3 3 0 t Ts s21(t) = -3 0 t Ts Mary- Quadrature Amplitude Modulation e.g. let M = 16, then {ai,bi} given based on
2(t) 1.5 0.5 0 -0.5 -1.5 1001 1111 1011 1110 1100 1101 1000 1010 -1.5 -0.5 0.5 1.5 1(t) 0001 0000 0100 0110 0111 0010 0101 0011 16 ary- Quadrature Amplitude Modulation • QAM: modulated signal is hybrid of phase & amplitude modulation • each message point • corresponds to a quadbit • Esis not constant – requires linear channel
ai1(t) + bi2(t) {ai,bi} = Mary- Quadrature Amplitude Modulation In general, for any M = L2
Mary- Quadrature Amplitude Modulation The average error probability, Pe for M-ary QAM is approximated by • assuming coherent detection • AWGN channel • no fading, timing jitter Pe In terms of average energy, Eav Pe Power Spectrum & Bandwidth Efficiency of QAM = MPSK Power Efficiency of QAM is better than MPSK
M 4 16 64 256 1024 4096 B = Rb/Bnull 1 2 3 4 5 6 Eb/N0 (BER = 10-6) 10.5 15 18.5 24 28 33.5 Mary- Quadrature Amplitude Modulation • M-ary QAM - Bandwidth Efficiency & Power Efficiency • Assume Optimum RC filters in AWGN • Does not consider fading, jitter, - overly optimistic
Mary Frequency Shift Keying MFSK - transmitted signals defined as si(t)= 0 t Ts, i = 1,2,…M • fc= nc/2Ts • nc = fixed integer si(t)= 0 t Ts, i = 1,2,…M • Each of Msignals have • equal energy • equalduration • adjacent sub carrier frequencies separated by 1/2Ts Hz • sub carriers are orthogonal to each other
Mary Frequency Shift Keying • MFSK coherent detection - optimum receiver • receiver has bank of M correlators or matched filters • each correlator tuned to 1 of M distinct carrier frequencies • average probability of error, Pe (based on union bound) Pe
Pe Mary Frequency Shift Keying • MFSK non-coherent detection • using matched filters followed by envelope detectors • average probability of error, Pe Pe = bound Pe use leading terms of binomial expansion
MFSK Channel Bandwidth Coherent detection B = Non-coherent detection B = • Impact of increasingMon MFSK performance • bandwidth efficiency(B) of MFSK decreases • MFSK signals are bandwidth inefficient (unlike MPSK) • power efficiency(P) increases • with M orthogonal signals signal space is not crowded • power efficient non-linear amplifiers can be used without • performance degradation
M M 2 4 16 4 64 8 16 256 1024 32 64 4096 B = Rb/Bnull B = Rb/Bnull 1 0.4 0.57 2 0.55 3 4 0.42 0.29 5 0.18 6 Eb/N0 (BER = 10-6) Eb/N0 (BER = 10-6) 10.5 13.5 15 10.8 9.3 18.5 24 8.2 28 7.5 33.5 6.9 M-ary QAM - Bandwidth Efficiency & Power Efficiency Coherent M-ary FSK - Bandwidth Efficiency & Power Efficiency
B 3 2.5 2 1.5 1 0.5 0 MPSK/QAM Coherent MFSK 0 4 8 16 32 64 M 30 25 20 15 10 5 0 MPSK QAM Coherent MFSK EB/N0 (BER = 10-6) 0 4 8 16 32 64 M Summary of M-ary modulation in AWGN Channel
log10Eb/ N0 16 PSK 16 QAM 15 12 9 6 3 BFSK 4 PSK/QAM BPSK 4 FSK 16 FSK Error Free Region -1.6dB -3 -2 -1 0 1 2 3 log2 C/B • Shannon Limit: • Most schemes are away from Eb/N0of –1.6 dB by 4dB or more • FEC helps to get closer to Shannon limit • FSK allows exchange of BW efficiency for power efficiency
BandwidthEfficiency B = Power EfficiencyEb/N0= energy used by a bit for detection Power & BW Efficiency
Power & BW Efficiency • ifC ≤ B log2(1+ S/N) error free communication is possible • if C > B log2(1+ S/N) some errors will occur • assumes only AWGN (ok if BW << channel center frequency) • in practice < 3dB (50%) is feasible S = EbC is the average signal power (measured @ receiver) N = BN0is the average noise power Eb = STbis the average received bit energy at receiver N0= kT (Watts Hz–1) is the noise power density (Watts/Hz), - thermal noise in 1Hz bandwidth in any transmission line


![SUBELEMENT T8 [4 Exam Questions – 4 Groups]](https://cdn0.slideserve.com/677287/subelement-t8-4-exam-questions-4-groups-dt.jpg)