The CIE System
670 likes | 1.71k Views
The CIE System. Dr Huw Owens. Introduction. Lights, Surfaces and Observers Colour Matching Experiments The CIE System Tristimulus Values Chromaticity Diagrams Dominant Wavelength and Purity. Standing in line to See the show tonight And there's a light of Heavy glow

The CIE System
E N D
Presentation Transcript
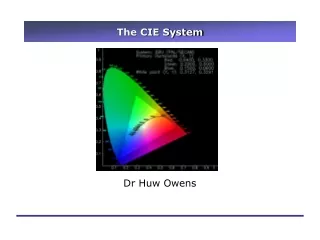
The CIE System Dr Huw Owens
Introduction • Lights, Surfaces and Observers • Colour Matching Experiments • The CIE System • Tristimulus Values • Chromaticity Diagrams • Dominant Wavelength and Purity
Standing in line to • See the show tonight • And there's a light of • Heavy glow • By the way I tried to say • I'd be there waiting for • Dani's the girl is • Singing songs to me • Beneath the marquee • Overload
The CIE System • Specifying colour can be difficult. Even if a physical sample is selected from a colour order system, its appearance will probably change with changes in illuminant and viewing conditions. • How can we simplify colour specification? Colour matching. • Colour matching first performed by Newton (1730). He found white light could be produced by mixing yellow and blue lights. • Colorimetry: A synthesis of two words, colour and metrein (Greek meaning to measure). It is the science of colour measurement. • Lovibond (1887) developed a device with which he could specify the colour of beer.
Colour Perception • Requires three factors Observer Light Source Object
Illuminants and Light Sources • A light source is a physical emitter of radiation such as a candle or the sun. • An illuminant is a table of spectral power distributions; a blueprint for a possible light source.
Standard Illuminants • In 1931 the CIE (Commision Internationale de l’Éclairage) defined 3 light sources by their SPD (relative power, 400-700nm). • A - a tungsten filament lamp • B - tungsten with yellow filter (sunlight) • C - tungsten with blue filter (daylight) B and C no longer used. • In 1964 the CIE introduced a further series of standards based on measurements of daylight and extended the spectral range. D50, D55, D60, D65 • D65 used in textile industry as standard daylight No lamp available to emulate D65 exactly.
1924 CIE Standard Photopic Observer Brightness: Attribute of visual perception according to which an area appears to emit, or reflect, more or less light (CIE 17.4)
Grassmann’s Laws of Additive Colour Matching • Symmetry Law – If colour stimulus A matches colour stimulus B, the colour stimulus B matches colour stimulus A. • Transitivity Law – If A matches B and B matches C then A matches C. • Proportionality Law – if A matches B, then αA matches αB, where α is any positive factor by which the radiant power of the colour stimulus is increased or reduced, while its relative spectral distribution is kept the same. • Additivity Law – If A, B, C, D are any four colour stimuli, then if any two of the following three colour matches: • A matches B, C matches D, and • (A+C) matches (B+D), then • (A+D) matches (B+C)
Test Field Admixture of three primaries Reference Field Admixture of three primaries
RGB colour-matching functions • CIE colour-matching experiment Wright’s observers’ results Blue Green Red
The Standard Observer • The CIE defined the colour vision of the ‘average’ human by asking a panel of observers to match the monochromatic spectral colours with red, green and blue lights, having first ‘balanced’ them to match a standard ‘white’ lamp. • In 1931 the CIE converted 2 sets of results, Wright’s (10 observers) and Guild’s (7 observers), so that the white and the 3 primaries were the same. They used the equal energy white (illuminant E) and 3 monochromatic primaries. However, this still meant that at any wavelength the amount of one of the primaries was negative.
RGB to XYZ colour-matching functions • Judd suggested to the CIE that new ‘supersaturated’ primaries be defined so as to avoid negative values. These were called X (red), Y (green) and Z (blue). They were defined by drawing a triangle which was outside the spectrum locus and the RGB triangle.
The Standard Observer • The standard observer is a set of colour-matching functions. These were obtained in 1931 for a 2 degree field of view. • In 1964 the CIE introduced a new set of colour-matching functions and these were obtained using a larger (10 degree) field of view. • CIE 1931 2 degree CIE 1964 10 degree • In 1964 the CIE also supplemented the original set of illuminants (A,B and C) with a new set of illuminants based upon the spectral power distributions (SPDs) of a blackbody radiator – these are the D illuminants. D65 is the spectral power distribution of a blackbody radiator at 6500K and is used to simulate daylight.
Computing Tristimulus Values Observer (colour- matching function) Tristimulus Value Illuminant Reflectance
Computing Tristimulus Values • k is a normalising factor, k = • This ensures that Y is always 100 for a perfect reflecting diffuser for any illuminant. Note that X and Z do not necessarily sum to 100.
Table of Weights Tables of weights are reproduced in many text books that pre-multiply K,E, and X,Y,Z.
The CIE Chromaticity Diagram • This is a 2-dimensional x,y chart which gives an indication of colour, but removes lightness information. • This can be rectified by quoting the Y tristimulus value as well as the x,y coordinates.
Tristimulus Values • The XYZ values can easily be computed. They quantify the amounts of the three imaginary primaries that an observer would use to match the stimulus if used in an additive mixture. They form a specification of the stimulus that takes into account the illumination, the surface and the observer. • However, they cannot be used to predict appearance!